


Jeremy Schneider


Postgres recovery_prefetch Considered Harmful and Causing Outages
Another story of something I saw in the field which surprised me. Turns out recovery_prefetch can cause outages.
Something which has been happening quietly in the background all the time, but we didn’t notice until we looked close enough to see it.
After a lot of work I discovered this was partly a case where someone had dropped an email to the postgres hackers list years ago “hey what about this” and everyone thought “nah it can’t be that bad” … and now here we are seeing production outages!
Exhibit A: Feb 2021, while the feature was being developed, a year and a half before it shipped, Stephen Frost
- Issuing unnecessary prefetches for blocks we’ve already sent a prefetch for is arguably a concern even if FPWs are off but the benefit of doing the prefetching almost certainly will outweight that and mean that finding a way to address it is something we could certainly do later as a future improvement. I wouldn’t have any issue with that. Just doesn’t seem as clear-cut to me when thinking about the FPW-enabled case. Ultimately, if you, Andres and Munro are all not concerned about it and no one else speaks up then I’m not going to pitch a fuss over it being committed, but, as you said above, it seemed like a good point to raise for everyone to consider.
https://www.postgresql.org/message-id/20210214231815.GO27507@tamriel.snowman.net
Exhibit B: Mar 2025, clear report from the field, Michael Zhilin (Postgres Pro)
- One customer complained that physical standby has significant replay lag (few hours) on modern powerful bare metal servers. According to output of “top”, startup process and few kernel workers utilized CPU, mostly in kernel space. The incident has been resolved by disabling recovery_prefetch after quick analysis of perf and strace outputs. Actual XLog prefetching code doesn’t consider that shared buffer may be loaded from WAL FPI rather than from disk and makes fadvise calls in such cases.
https://www.postgresql.org/message-id/9bdb428a-fc8e-4801-8fff-1ad0bc6fa76b%40postgrespro.ru
Both of these emails were on the right track, but didn’t quite get the complete picture yet.
First: FPI/FPW is ubiquitous today. While it’s very expensive in terms of performance, it’s the only way Postgres has of protecting from torn writes on OS restarts. As a result, the majority of production Postgres installations today enable this.
Second: synchronous replication is becoming more common. There are really only two ways to completely protect community open source postgres against data loss on hardware failures: (1) storage layer replication with oss tech like DRBD or expensive proprietary storage & clustering technology or (2) database layer protection with postgres synchronous replication. The second option is the normal solution with kubernetes and commodity hardware.
Third: something that hasn’t previously been diagnosed/reported – the problem with recovery_prefetch isn’t just about FPIs, it’s also about the fact that when the primary instance does large sequential I/O, recovery_prefetch converts those operations into 8k random reads. For the same number of bytes read, this amplifies IOPS as much as 16x on replicas. This can easily exhaust available IOPS, causing replicas to significantly lag after write activity.
The read IOPS amplification combined with Postgres design for synchronous replication is what turns recovery_prefetch into an actual outage-inducing killer. And it turns out this is trivial to reproduce once you know the steps.
- Start up postgres with synchronous replication to a standby, on a small server with an inexpensive hard drive (for example: cloud disk with 500 IOPS, 2 CPUs, 8GB memory)
- Initialize pgbench scale 640 for about 10GB data
- Disable autovac on pgbench_accounts just so it doesn’t interfere with the experiment.
- Run pgbench at 5 TPS fixed in a terminal you can watch.
- Update 5% of the table. (Checkpoint and update pgbench_accounts where aid%20 = 0.) This generates a burst of write activity. Pgbench will slow down until it finishes. Wait for this to complete.
- Kill the walreceiver process to emulate what happens when there’s a hang or network instability that disrupts this connection.
- TPS drops to zero and all writes hang for over 30 minutes (can be hours with larger pgbench table).
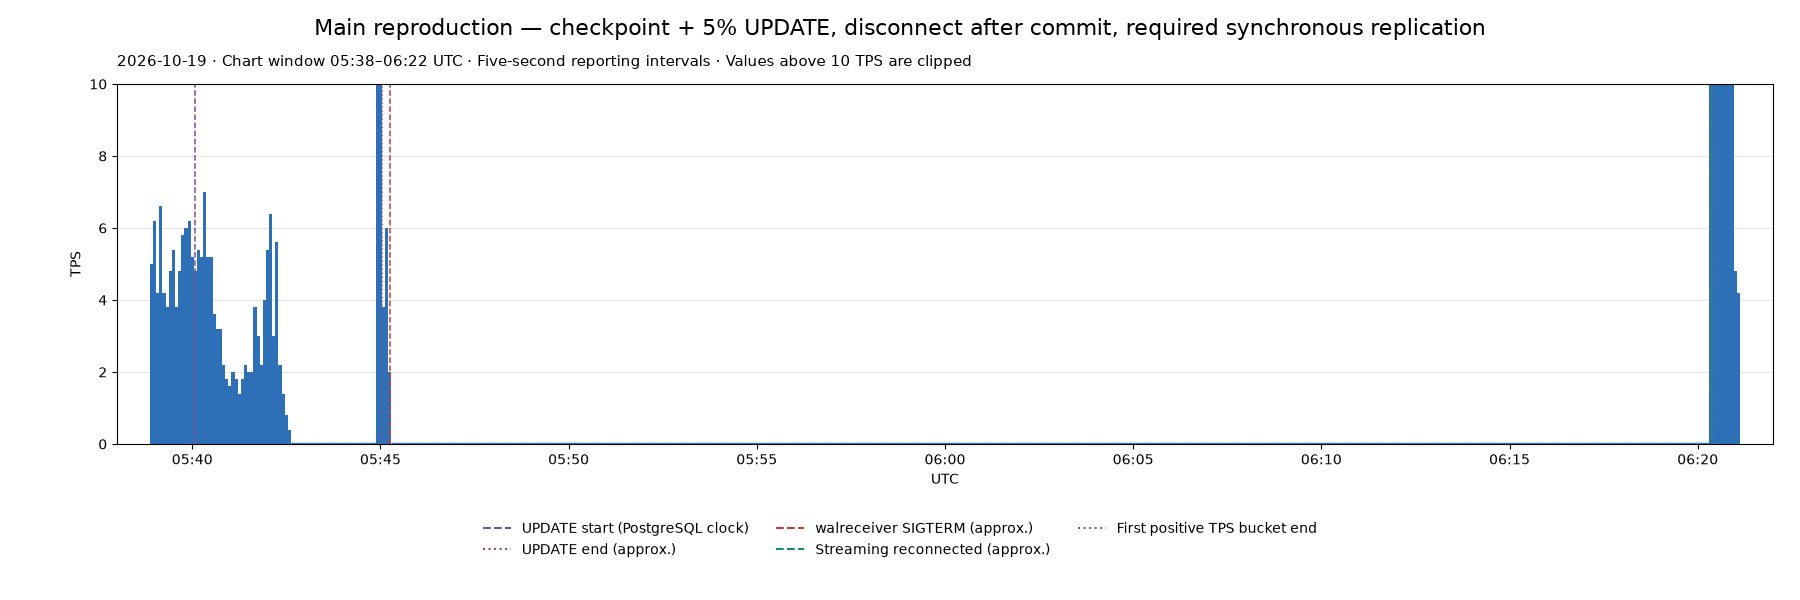
It really is this easy to consistently reproduce this outage. https://github.com/ardentperf-labs/walreceiver-outage-repro
And for what it’s worth, VACUUM itself is quite capable of producing write activity too. The recipe for an outage is simply “enough bad luck”: a network glitch that interrupts streaming replication at the same time as a burst of write activity.
To understand why the whole system hangs, it really comes down to two simple things: (1) synchronous replication and (2) the core “state machine” that defines a Postgres Standby Server.
Remember that with synchronous replication, we’re depending on at least one healthy standby server – otherwise we can’t take writes. (We want to guarantee durability to clients and ensure every transaction is on a remote machine before commit.)
The core standby server state machine is defined in src/backend/access/transam/xlogrecovery.c:
WaitForWALToBecomeAvailable(XLogRecPtr RecPtr, bool randAccess,
							bool fetching_ckpt, XLogRecPtr tliRecPtr,
							TimeLineID replayTLI, XLogRecPtr replayLSN,
							bool nonblocking)
{
	static TimestampTz last_fail_time = 0;
	TimestampTz now;
	bool		streaming_reply_sent = false;

	/*-------
	 * Standby mode is implemented by a state machine:
	 *
	 * 1. Read from either archive or pg_wal (XLOG_FROM_ARCHIVE), or just
	 *	  pg_wal (XLOG_FROM_PG_WAL)
	 * 2. Check for promotion trigger request
	 * 3. Read from primary server via walreceiver (XLOG_FROM_STREAM)
	 * 4. Rescan timelines
	 * 5. Sleep wal_retrieve_retry_interval milliseconds, and loop back to 1.
	 *
	 * Failure to read from the current source advances the state machine to
	 * the next state.
...
...
Fundamentally it looks like this:
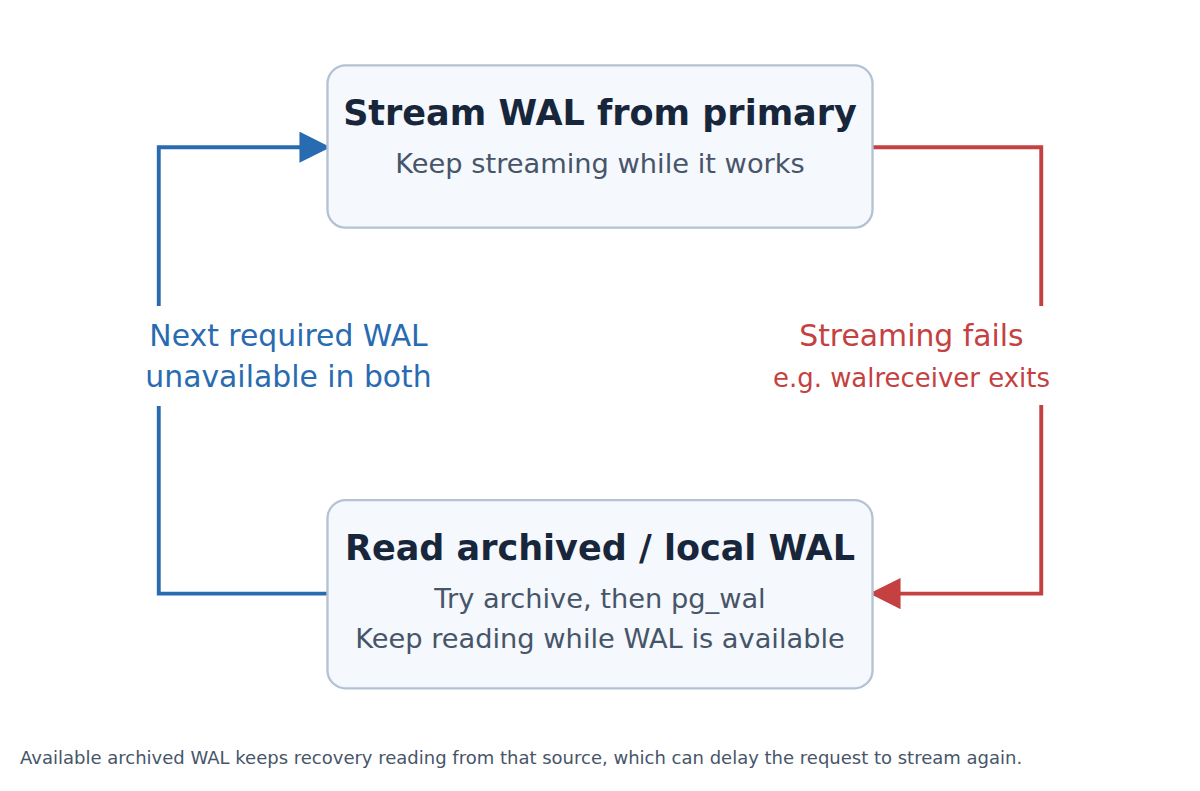
Basically, when a Postgres standby switches into WAL-restore mode, it will not go back to streaming until it’s caught up.
A burst of write activity combined with IOPS amplification on all the replicas that causes significant lag can easily mean the database won’t start streaming again for hours.
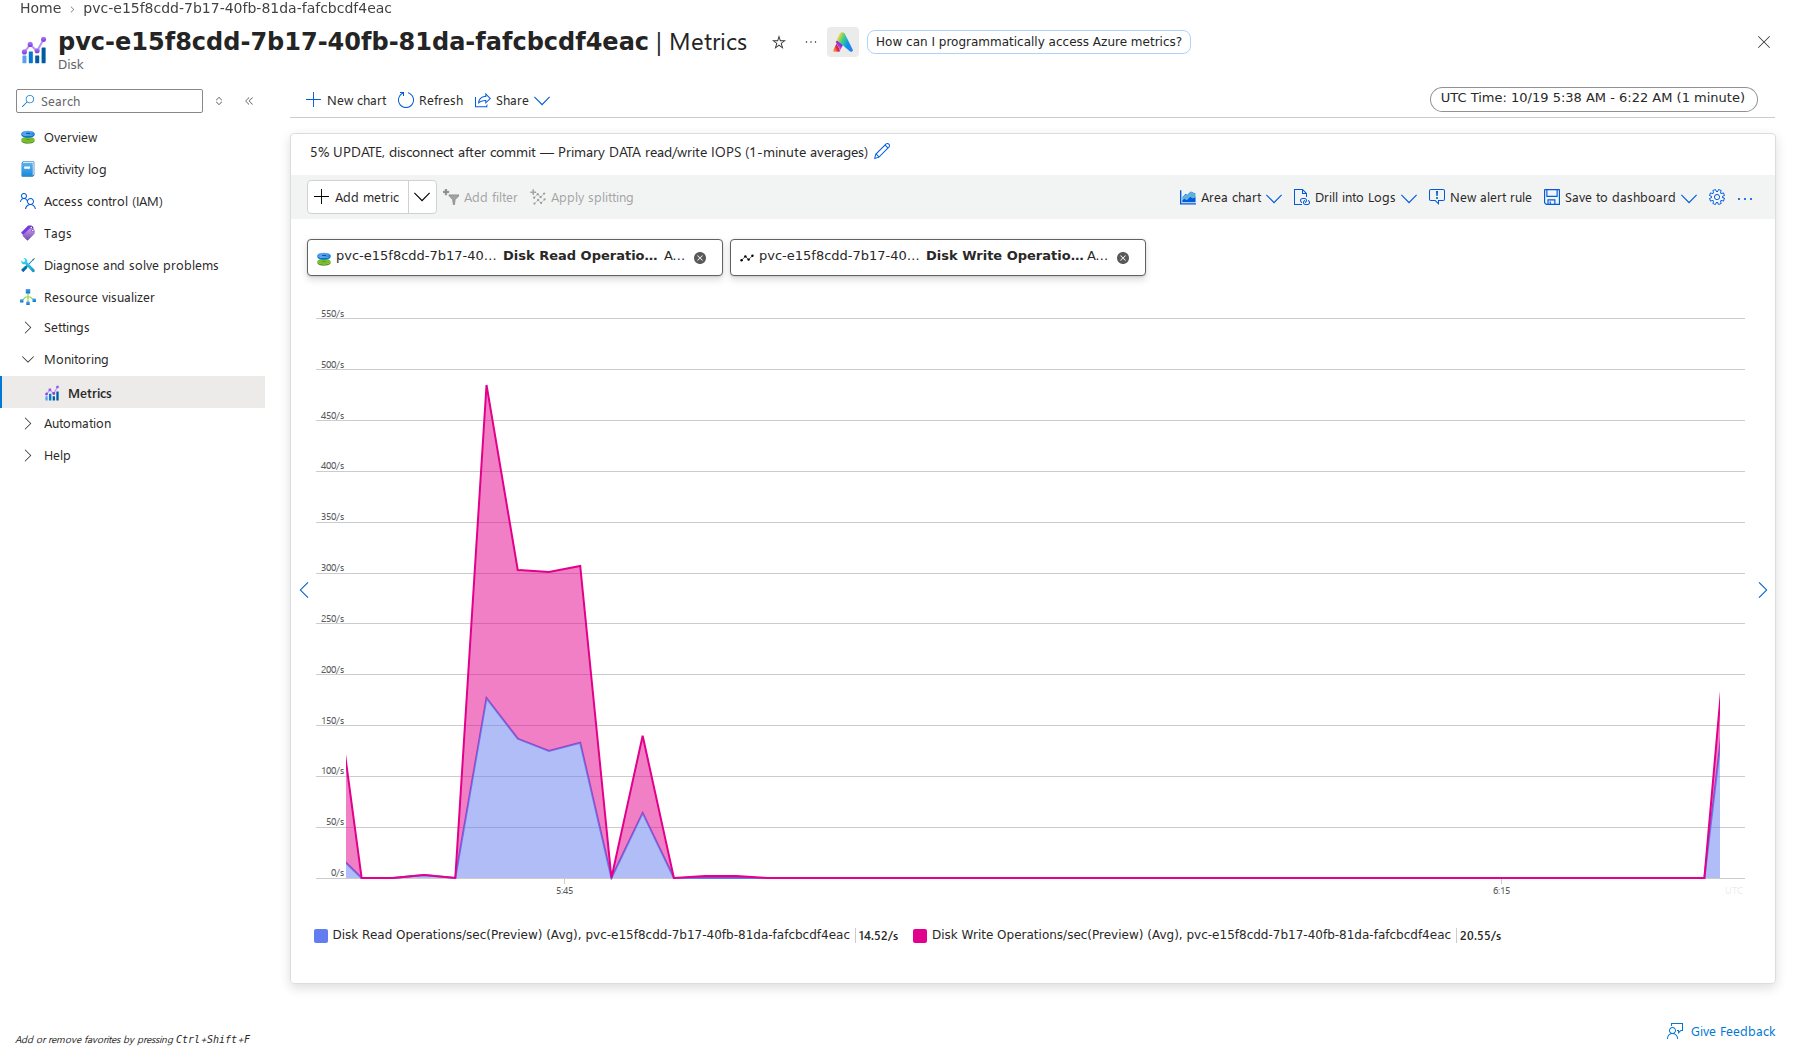
The IOPS amplification is very clear. Here are the disk stats for the primary (maybe 5 minutes around 300 IOPS):
Here are the disk status for the replica/standby during the same time period (40 minutes at the disk limit of 500 IOPS):
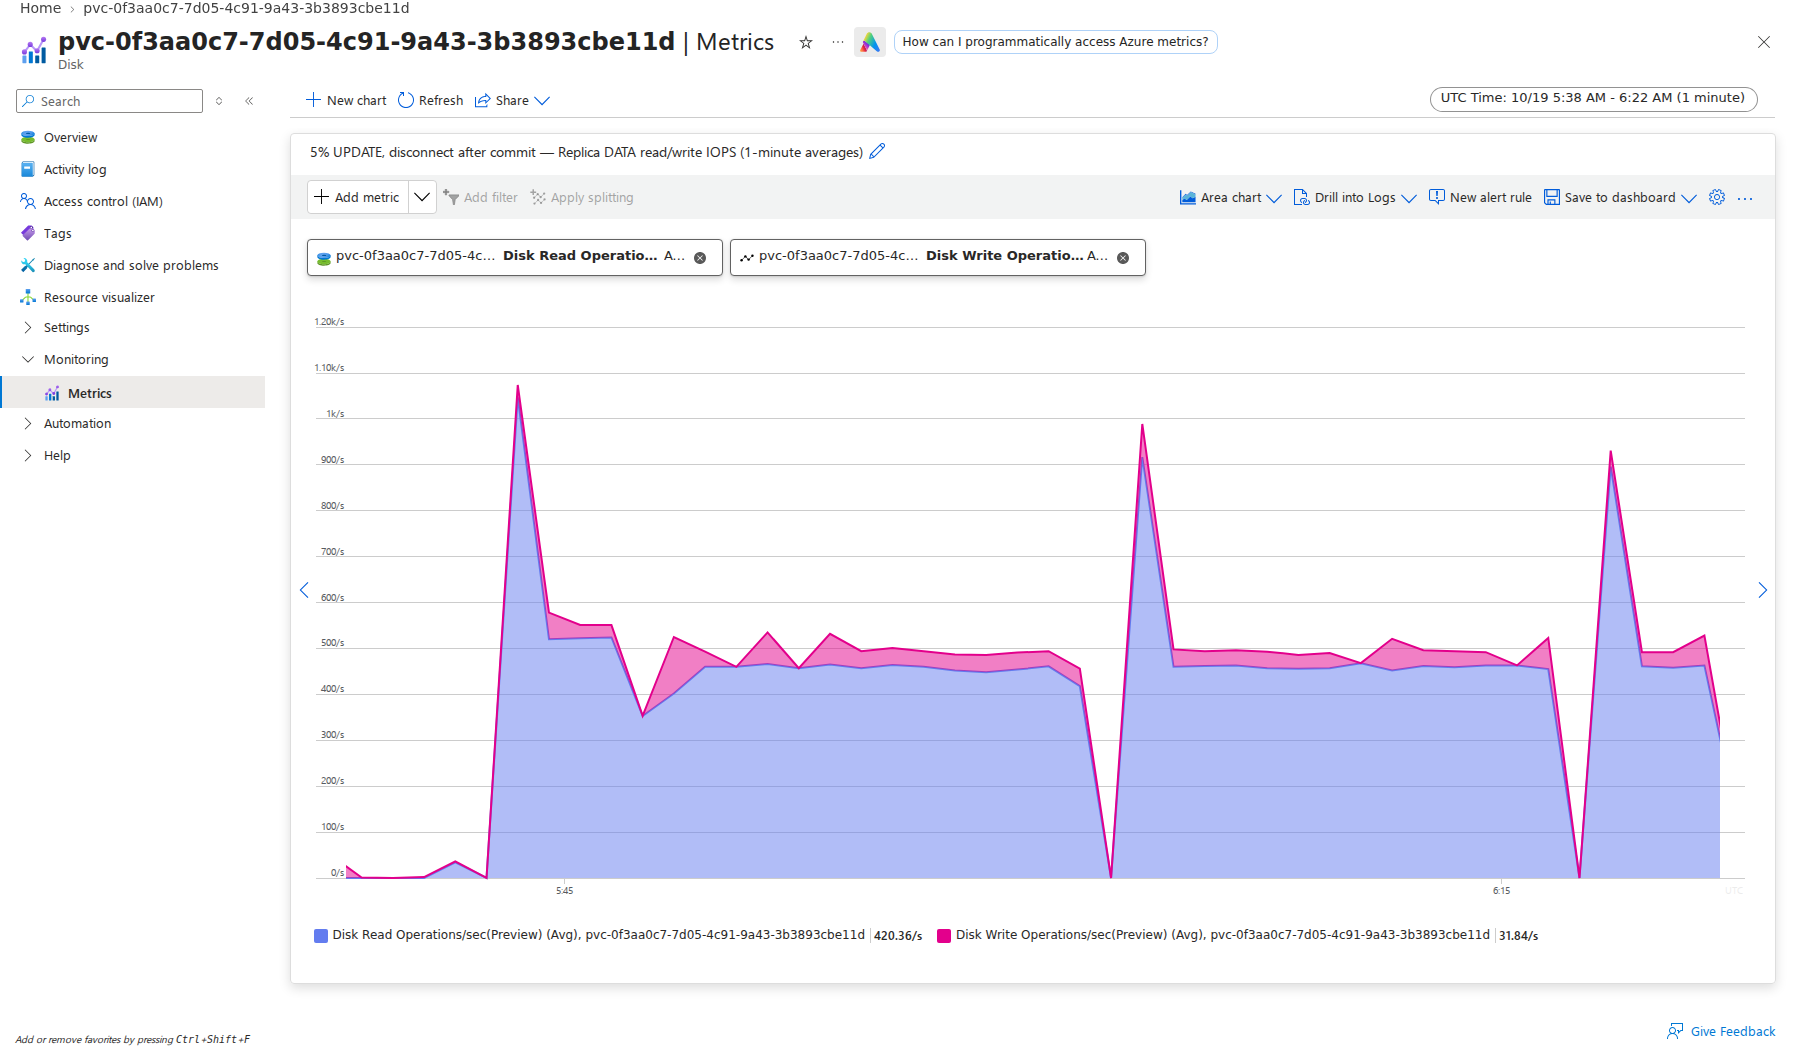
These charts don’t illustrate it, but the number of bytes read from disk is about the same.
What happens if we disable recovery_prefetch? (Note that FPWs remain enabled.)
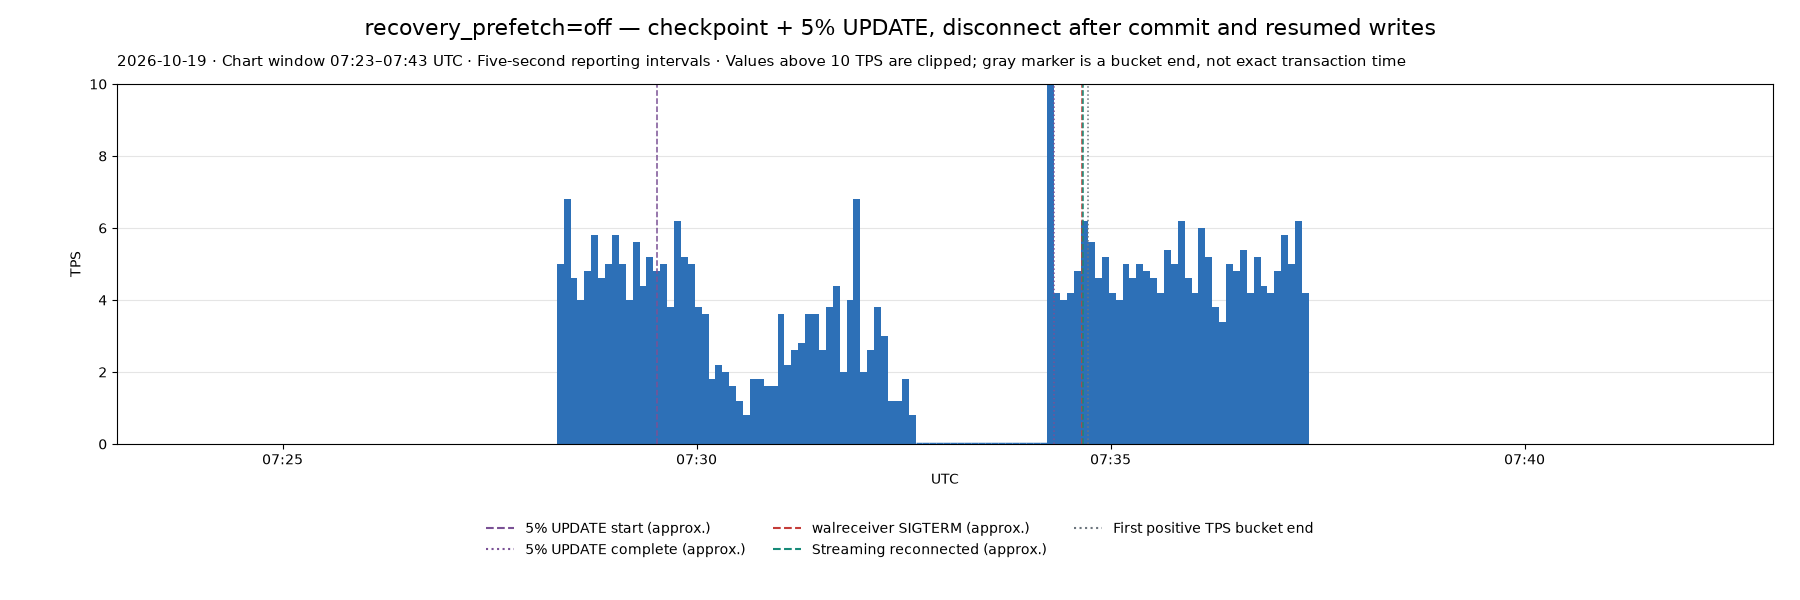
There’s still the pause during UPDATE but we didn’t see the long pause after UPDATE completes.
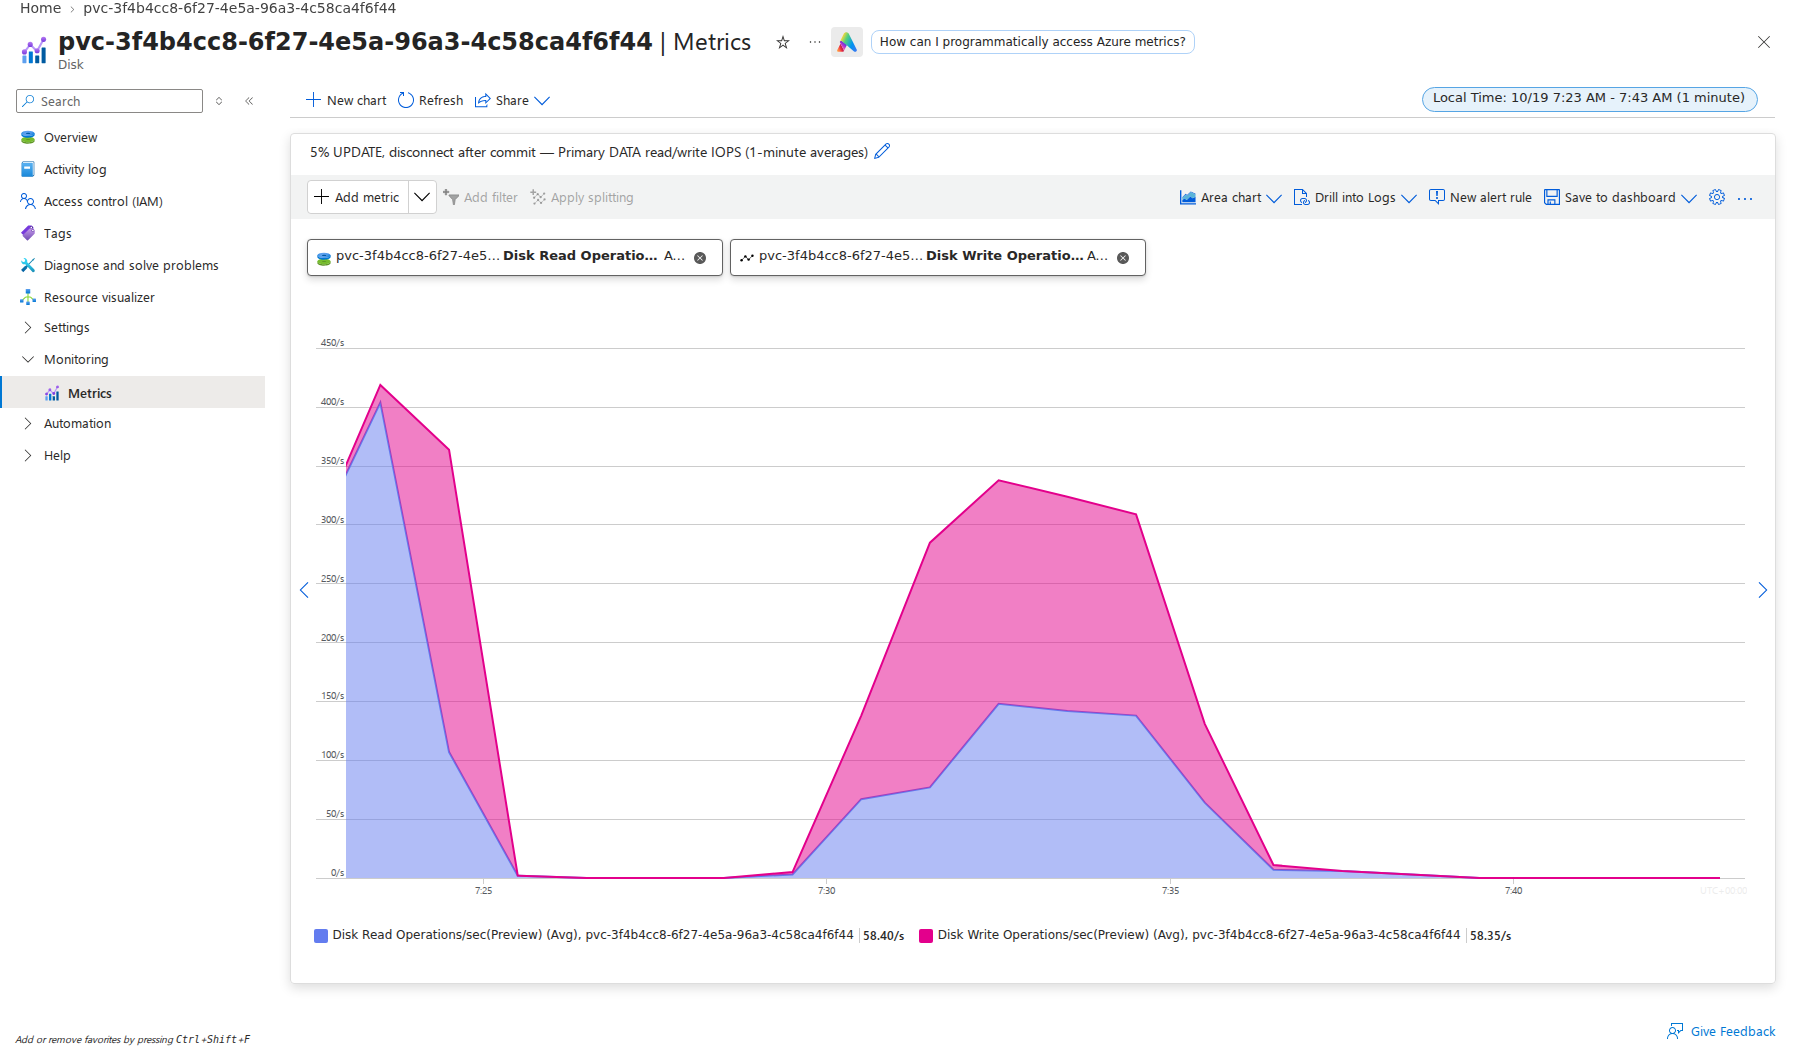
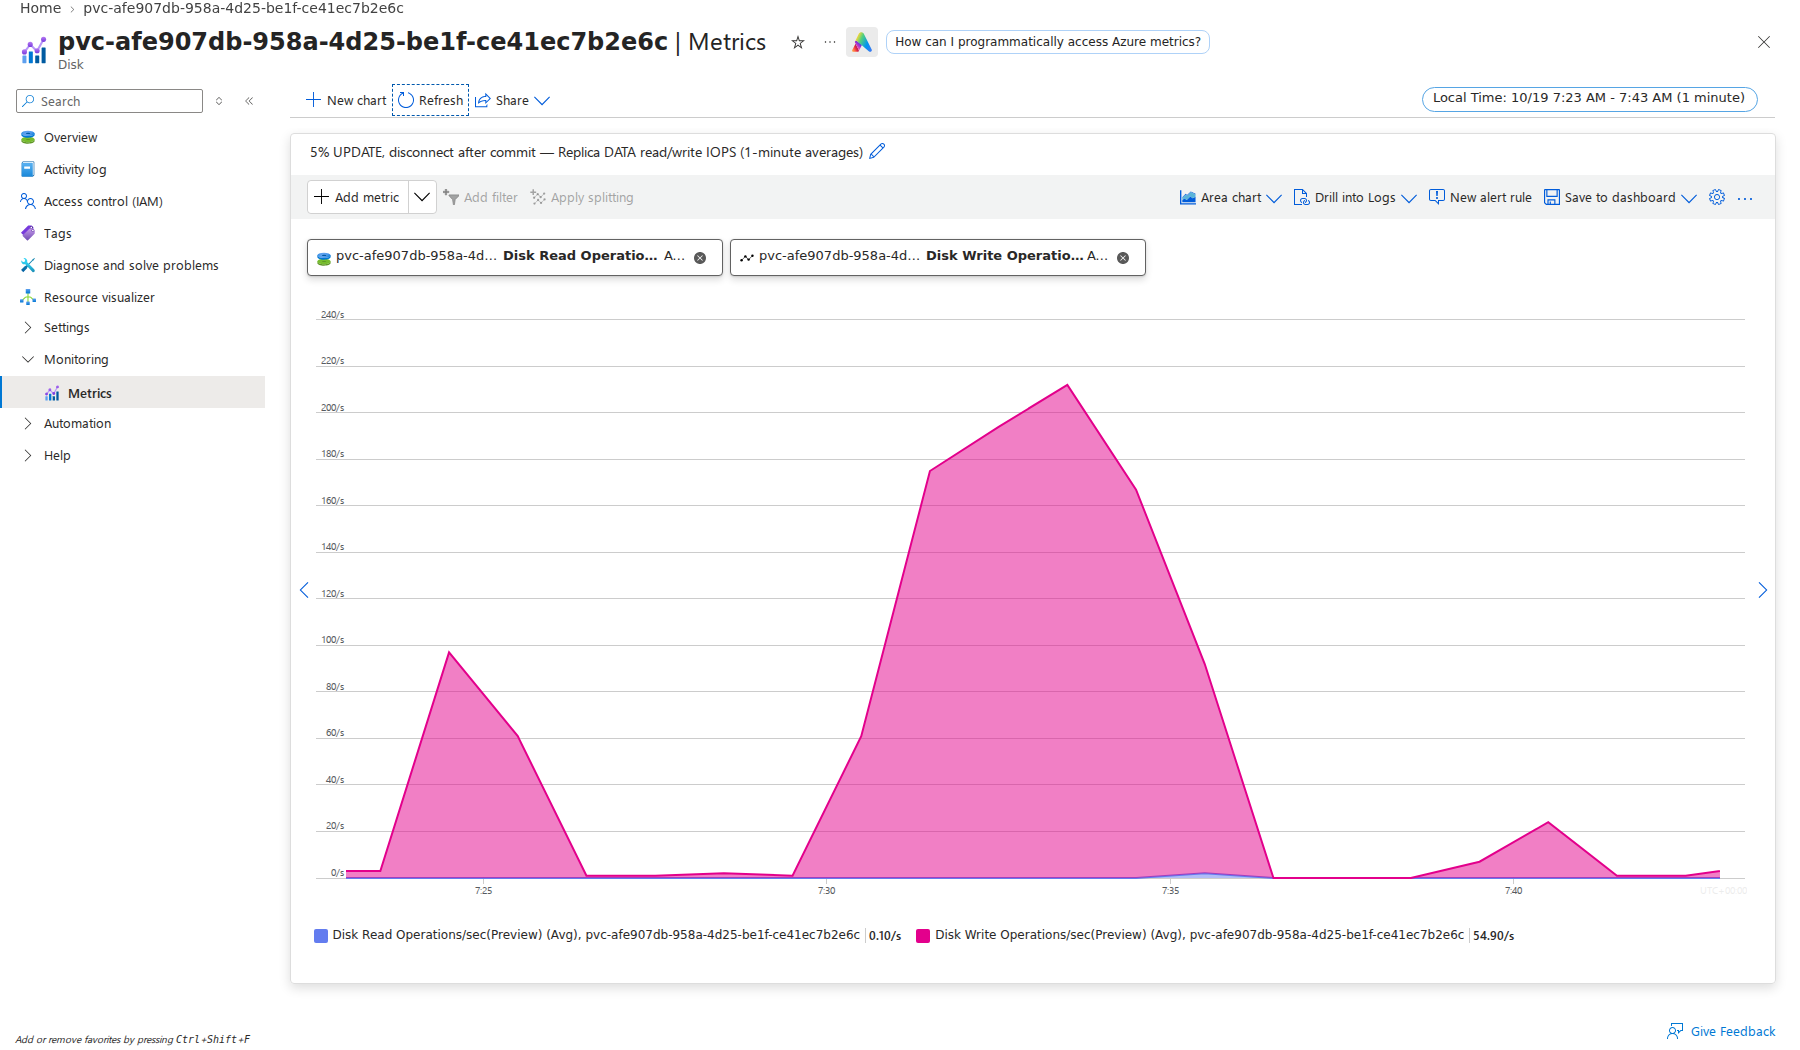
There is no burst of read IOPS, and the standby server basically stays caught up – applying the 5% update in less than 10 minutes.
Right now, I’m leaning toward disabling the recovery_prefetch setting across the board but I want to see where the discussions go.
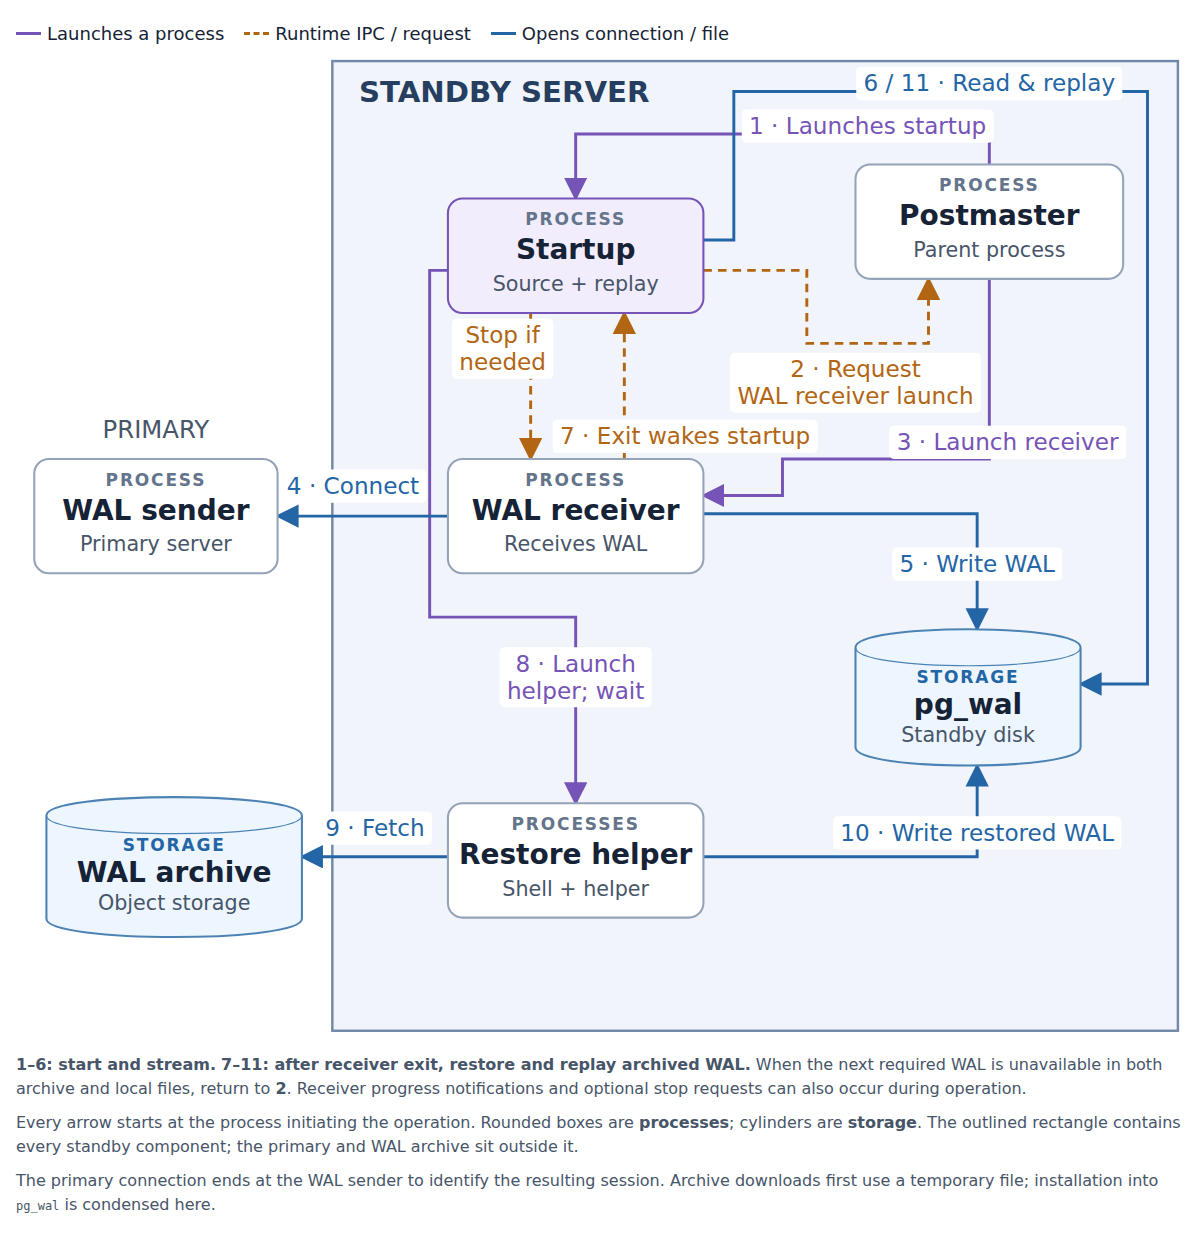
Here’s a more detailed refresher on the various processes involved in the core restore and replay logic of a postgres standby server.
Importantly, note the direction of the arrow between the WAL sender and WAL receiver. With synchronous replication in Postgres this connection is critical – the primary can’t accept writes without it. It’s also very fragile, because if the connection disappears the primary can only sit and wait, blocking all writes, hoping a standby will reconnect soon!
This is a reason to consider two standbys and quorum commit (ANY 1) with postgres. While it does increase cost to run with three total replicas instead of two, it significantly increases the robustness of the database.
Agents Gone Awry on Postgres SBOMs: Start Over
If you were wondering, it’s the SBOM thing that I mentioned the other day.
Postgres Extensions in containers with full inventory, provenance and attestation. I’ve been using plenty of AI Agents to put this together. This blog is a little scattered (apologies) but as they say, I didn’t have time to write a short letter.
Here’s what I believe to be the exact structure of current CloudNativePG images:
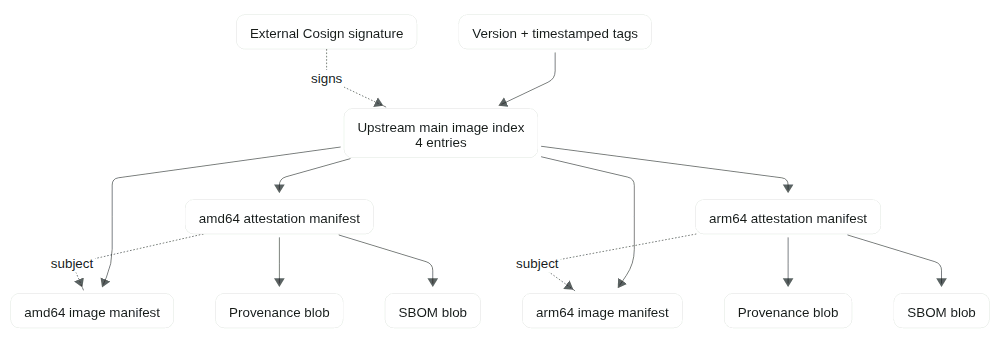
I have a bunch of irons in the fire related to this project:
- A downstream fork of CloudNativePG/postgres-extensions-containers which can host a bunch of Open Source code which isn’t allowed by CNCF.
- I track upstream build infra, design my changes to minimize merge conflicts
- A set of patches fixing issues I’ve found, which I’ve submitted upstream
- Patches are applied on my fork so that I can get stuff working
- Upstream often tweaks stuff, so then I need to deal with the merge
- This huge new feature – adding proper SBOMs – which is in a feature branch off my repo
- Planning to submit this upstream
- Stacked on top of my other fix PRs
- Another huge new feature – PGRX build support – which is stacked on this SBOM feature
- Not submitted upstream, will only live in my fork
- Still want to structure code to minimize merge conflicts from upstream
After working on this for like a week, I realized that the set of commands to validate the security and provenance info was going to be totally different for PGRX than for upstream.
I think this is too confusing to users. There needs to be one simple, consistent command to verify provenance and SBOM material. I didn’t have that at the beginning and the AI Agent enabled racing ahead with the code. I didn’t realize the issue until now.
One thing I had been focused on was not having a bunch of things to copy, if someone needs to mirror images to a private container registry. With that focus, this is what I had inadvertantly ended up with.
For Debian-based extensions:
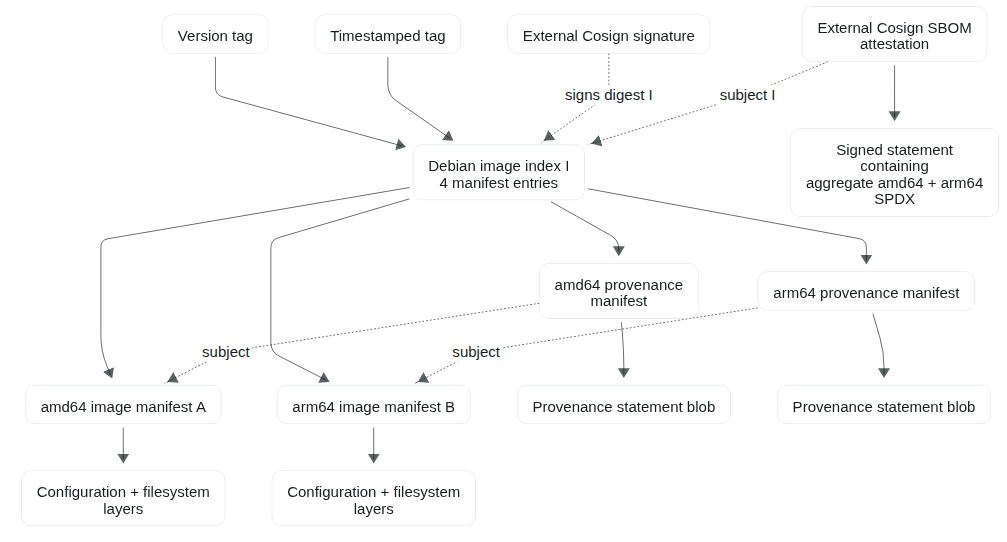
On the PGRX side, builds were timing out because they ran under qemu emulation. (Which is fine if you’re just installing debian packages.) I refactored the PGRX build to use native GitHub Runners, so that it would use this new design:
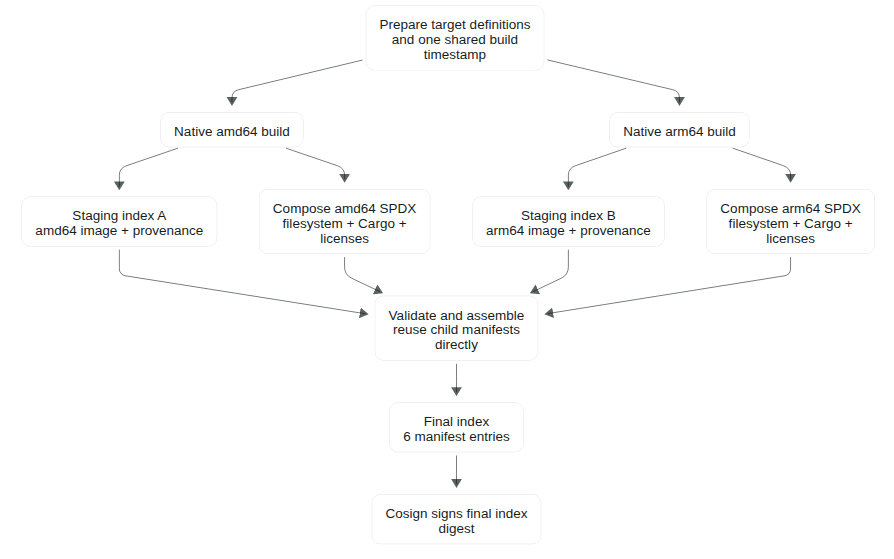
But after that refactor, the Debian images would look the same as previously, while the PGRX images would now look like this:
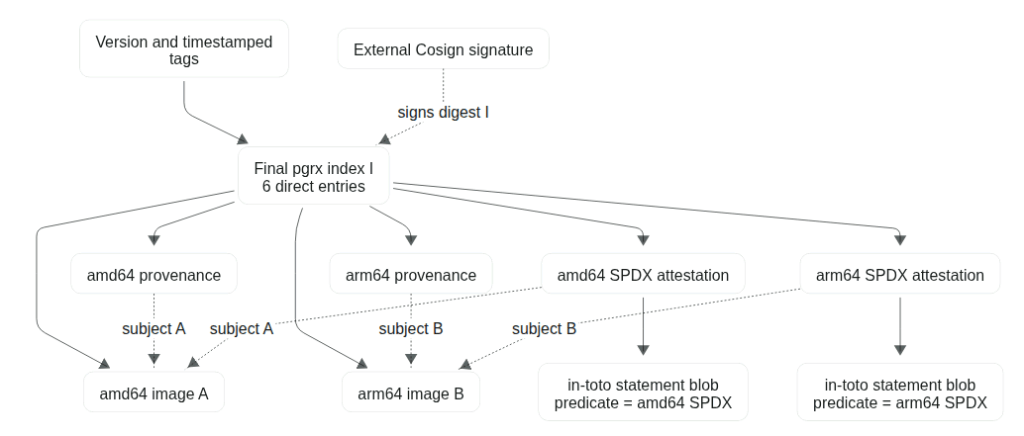
Here’s how Codex summarized it for me:
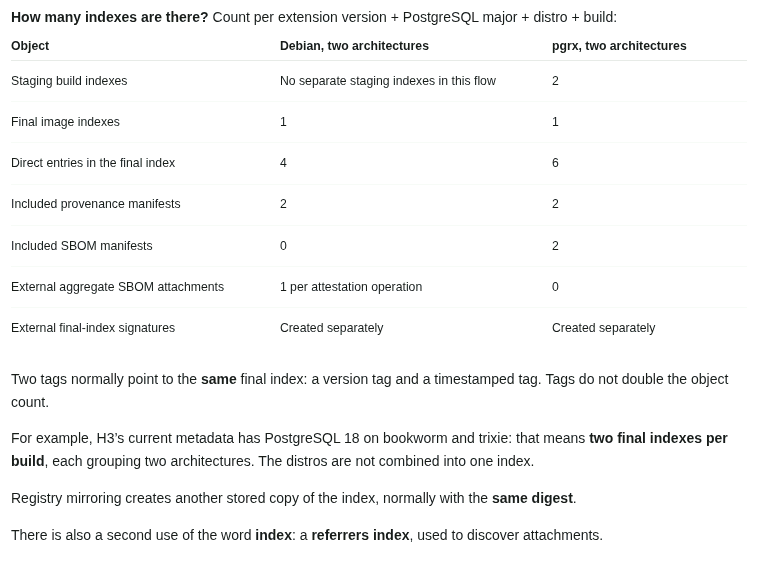
The main issue is that now it’s a totally different set of commands for users to validate PGRX containers. Most users don’t know or care how I built the container. They just want to use a Postgres extension.
Well this was no good. Time to go back to the drawing board and start over on the design.
Docker has a neat feature where you can provide a custom SBOM generator. This approach didn’t get used in my original design.
So using the agents, I rebuilt everything to use this approach. I also included a plugin API which was designed to be used by my PGRX build process later. Codex was able to leverage the previous code for actually composing the SBOM when it did the refactor. So far, this re-design is looking far more elegant and clean.
Most of the logic ends up self-contained in the custom sbom-generator module. The required changes to the build pipelines were surprisingly minimal. After a lot of work, here’s what I ended up with:
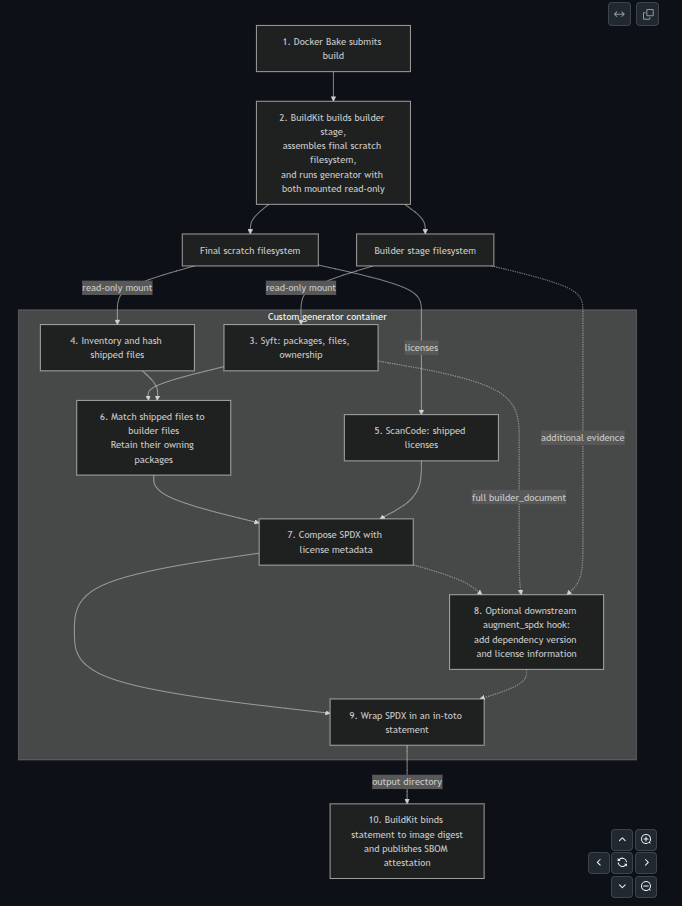
This link will probably break once I’ve merged things and cleaned up working branches, but if anyone is curious: https://github.com/ardentperf/postgres-extensions-containers/tree/x-ai/ardentperf/cnpg-sbom-generator/sbom-generator
One thing that AI could not do: correctly tell me what the right design was. Because it relies on me to know the right questions to ask, telling it the goals & priorities of the design.
Next up: refactoring the PGRX branch on top of this one (without losing native build hosts), cleaning up docs & code here and submitting this PR upstream, continuing to chase my handful of other open PRs upstream.
In the meantime – if anyone is running CloudNativePG and you need extensions… the CNPG-Extensions Project is available for testing now! It’s got quite a bit more advanced automation than the upstream at this point. Renovate is fully automated so that when a new extension version drops, you should automatically see it here (and in the Image Catalogs) quickly.
PG-Cron, PG-Partman, PG-Hint-Plan, PG-Stat-KCache, PGSentinel, PLDebugger, PLProfiler, MySQL/MSSQL FDWs… and lots more!
https://github.com/cnpg-extensions/postgres-extensions-containers
And soon (once I merge the first big PR): with full detailed and attested SBOMs and Provenance.
Misc Learnings: SBOMs, Provenance and Attestations
In the past couple weeks, I’ve learned more about renovate, SBOMs, provenance and attestations than I ever wanted to know. (But if I’m being honest, I do enjoy learning a bit more about it.)
Backstory is that I decided to make CNPG-Extensions an actually serious project. The original name was “Not-CNPG” as a joke about CNCF’s restrictive licensing policies which forbid hosting open source software with licenses like GPL. https://github.com/cnpg-extensions/
As a “serious” project I wanted to provide provenance info so users can more have assurance about the contents of a container image, and so that scanners can accurately report licenses and compare software versions against vulnerability databases. This week I also started exploring support for pgrx extensions with full rust dependency graphs in the SBOM so that tools like trivy can flag RUSTSEC vulns even on packages buried in the dependency tree.
Example Trivy output for a Debian-based extension:
Example Trivy output for a pgrx-based extension (this is not final):
A few things I’ve learned along the way:
- Renovate auto-update problem: some extensions (MySQL FDW, PL/Debugger) have a sql version that’s completely different from the package version. There’s no way to know the SQL version outside of manually inspecting source code or firing up a full test container.
- Renovate auto-update decision: I don’t want to promote “release candidate” or “beta” versions on channels that users consider to be stable releases. How this is reflected in a version string varies by extension; requires manual check before promotion. But I want stuff as automated as possible ~ generally I don’t want to have to be approving PRs all the time. I might do a little research and only disable auto-update for extensions that have had beta/rc versions in the past.
- Two ways to sign attestations: Cosign/Sigstore or GitHub Artifact Attestations. CNPG currently uses Cosign. I ended up trying out GitHub Artifact Attestations… until a few days later when I stumbled across a random GH Issue on the ParadeDB project which pointed out that GitHub might have paywalled some of the functionality here behind Enterprise subscriptions (I think for people mirroring repos). So then I went and migrated all my working branches back to Cosign, re-ran tests, etc.
- SBOM problem: docker/moby buildkit uses syft to generate an SBOM. latest version of syft still has open issues around debian packages and basically it can’t detect licenses for a huge number of them. so the default docker SBOM is always missing a bunch of license info.
- my workaround: adding CodeScan. then CodeScan promptly crashed on the PL/R license file because the file was too big. so i split the file into chunks using a marker at the beginning of each license and scanned each file. this worked and gave me a super highly reliable license scan, though I had to manually re-assemble an SBOM.
- If you install the latest rust using the method where it compiles cargo-about and cargo-cyclonedx, those two packages take… a loooooong time. For two large pgrx builds (pg-parquet and pg-search), my GitHub action workflows hit the six hour timeout and got killed.
- Turns out trivy can also generate SBOMs including Cargo.lock parsing… but you need the latest version because even something as recent as 0.66.0 has bugs where it couldn’t parse Cargo.lock if the project used workspaces. https://github.com/aquasecurity/trivy/issues/10007
- Even the latest version of Trivy has a bug where it misses git-only deps. AI told me there wasn’t an existing issue… hopefully was right; I filed a new one https://github.com/aquasecurity/trivy/discussions/11236
- Trivy doesn’t seem to have any capability to emit CONTAINS records in the SPDX SBOM. So I still need syft because I want to work backwards from files actually copied to the extension scratch container, to figure out which packages are included.
- “Modern” software languages (um, like less than a couple decades old?) that handle dependencies are wonderful. But I wanted to add pg-duckdb which is in C++ and so now I need bespoke pg-duckdb dependency processing build scripts… at least this gets easier with AI agents to help do the coding… but yeah not wanting to commit myself to maintaining any custom build systems unless it’s really worthwhile (AI or not)
- GitHub CI being as powerful as it is – and offering free compute – is a much more significant contribution to Open Source than they get credit for. My project to build, test, host and distribute a bunch of kubernetes postgres extensions with strong provenance across two architectures, two major Debian OS base containers, three versions of CloudNativePG… this can trigger some rather impressive counts of GitHub jobs! Like hundreds! And I’m amazed just how much compute GitHub gives away for free, which supports Open Source projects like this.
There are still some big open questions in my mind around how to best manage Postgres Extensions with CloudNativePG. How high of a bar for contributions? How much review is needed? What level of commitment from a contributor is expected – do we want to avoid drive-by contributions of big chunks of code which could become a liability – and how to decide whether to trust someone?
Maybe my CNPG-Extensions project can be an option for a lower bar, in addition to the licensing concerns. But I’m not sure. How important is provenance? I’ve put a lot of effort into it this past week. I’m not sure about random debian packages downloaded from GitHub; how do we know they were built correctly? Do we care? If a package is in the official Debian or PGDG repositories then I tend to have a little more trust in it – is that justified?
And then there are the AI related topics: just because you can ask an AI agent to rewrite the operating system on your laptop, doesn’t actually change the fundamentals of computing that much. Decades ago I had fun running my own wordpress site. I learned a bit and it fueled my enthusiasm. But after the third time cleaning up a hack I decided I’d rather spend my time elsewhere, and I started paying someone else to manage that part. AI agents are getting lots of people excited about coding again which is great. But eventually it comes back to boring and well maintained platforms.
Anybody can throw some code on the internet. That doesn’t mean anybody will maintain the code – ensuring that things are rebuilt after Log4Shell happens again, two years from now. AI is great at writing code but you still better pay attention to what human is at the steering wheel and whether they seem like they are paying attention, or seem like they have any level of commitment to stick around. Or alternatively you need to be willing to take full ownership/responsibility yourself.
I like the OpenSSF scorecard for this; it’s worth a read. https://scorecard.dev/
Just a reminder that AI doesn’t change this – it’s more important than ever.
And a final random musing… here’s a picture of my whiteboard right now where I’m trying to track a hierarchy of five different work streams that I have going all at the same time! Each is a separate git branch, forked from the branch above it (and requiring a rebase whenever an upper branch changes something). Agents mean I can fire off long-running tests and come back 12 hours later to check results and make design decisions, but having five different work streams in parallel is a lot of mental overhead – it’s a little tiring!

Why Postgres Breaks Kubernetes container_memory_working_set_bytes Metric
Kubernetes metric container_memory_working_set_bytes is used for evicting/killing pods with too much memory use, especially if memory request < limit (don’t do this with Postgres). The metric is calculated from cgroups v2 memory.stat as current-inactive_file [source].
You’d assume it’s a good metric for memory usage in kubernetes. But with Postgres, this metric is very inaccurate for memory utilization and doesn’t tell you at all if you’re going to OOM crash your database.
After having the same conversation so many times about Postgres on Kubernetes, I need to write it down so I can just send people here to read it.
I will show better metrics to watch.
We start with fundamentals.
Note: scripts to reproduce all tests and graphs are at https://github.com/ardentperf/cgroup-postgres-memtest
Kubernetes Node E2E TestsThis is ground-zero for what Kubernetes promises to be true. AI research is telling me make test-e2e-node has several memory-pressure eviction tests:
- MemoryAllocatableEviction [source]
- MemoryAllocatableEvictionPodLevelResources [source]
- PriorityMemoryEvictionOrdering [source]
- PriorityMemoryEvictionOrderingPodLevelResources [source]
I believe these tests all use a test kit called agnhost [source]. Lets fire it up in docker and grab a few cgroup v2 metrics
docker run --name graph-repro-run_1-1821100 \
    --memory 512m --memory-swap 512m --detach \
    registry.k8s.io/e2e-test-images/agnhost:2.47 \
    stress --mem-alloc-size 25Mi --mem-alloc-sleep 5s --mem-total 1Gi
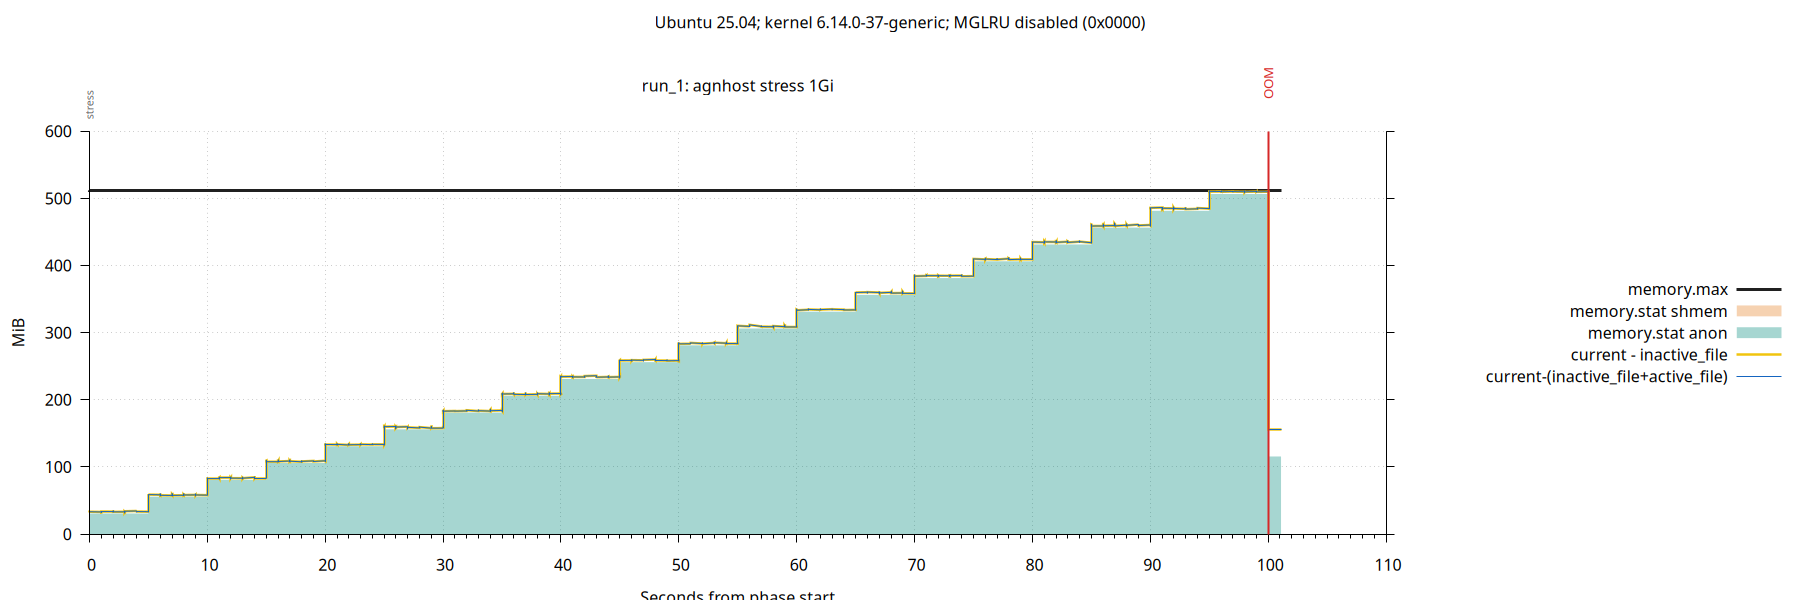
container_memory_working_set_bytes is the yellow line: current-inactive_file. It tells current memory usage, excluding linux page cache contents on the “active” file LRUs. The blue line is my own metric, where I’ve excluded all file LRUs (both active and inactive) – basically I’m saying “memory usage not including the page cache”.
Looking at the graph:
Anonymous memory ramp-up. As expected, OOM when memory usage hits the cgroup max (aka Pod Memory Limit). If you’re taking notes, remember that OOM will be a full database crash and restart for Postgres.
Simple. No shmem in the test, no active page cache in the test.
Now Postgres.
docker run --name graph-repro-run_2-1821100 \
    --memory 512m --memory-swap 512m --detach \
    --env POSTGRES_PASSWORD=graphrepro \
    postgres:18 \
    -c shared_buffers=128MB
In a loop, let’s run a SQL query that sorts rows in memory. Add a half million rows each time until we OOM.
By default, Postgres limits itself to 4MB of working memory for sorts, and spills to temp files on disk after that. Tell Postgres to use more working memory. (Usually you’d decrease working memory if there are lots of concurrent connections all needing memory…)
SET work_mem = '1GB';
SET max_parallel_workers_per_gather = 0;

SELECT count(*) FROM (
  SELECT md5(n::text) AS sort_key
  FROM generate_series(1, $rows) AS input(n)
  ORDER BY sort_key
) AS sorted_values;
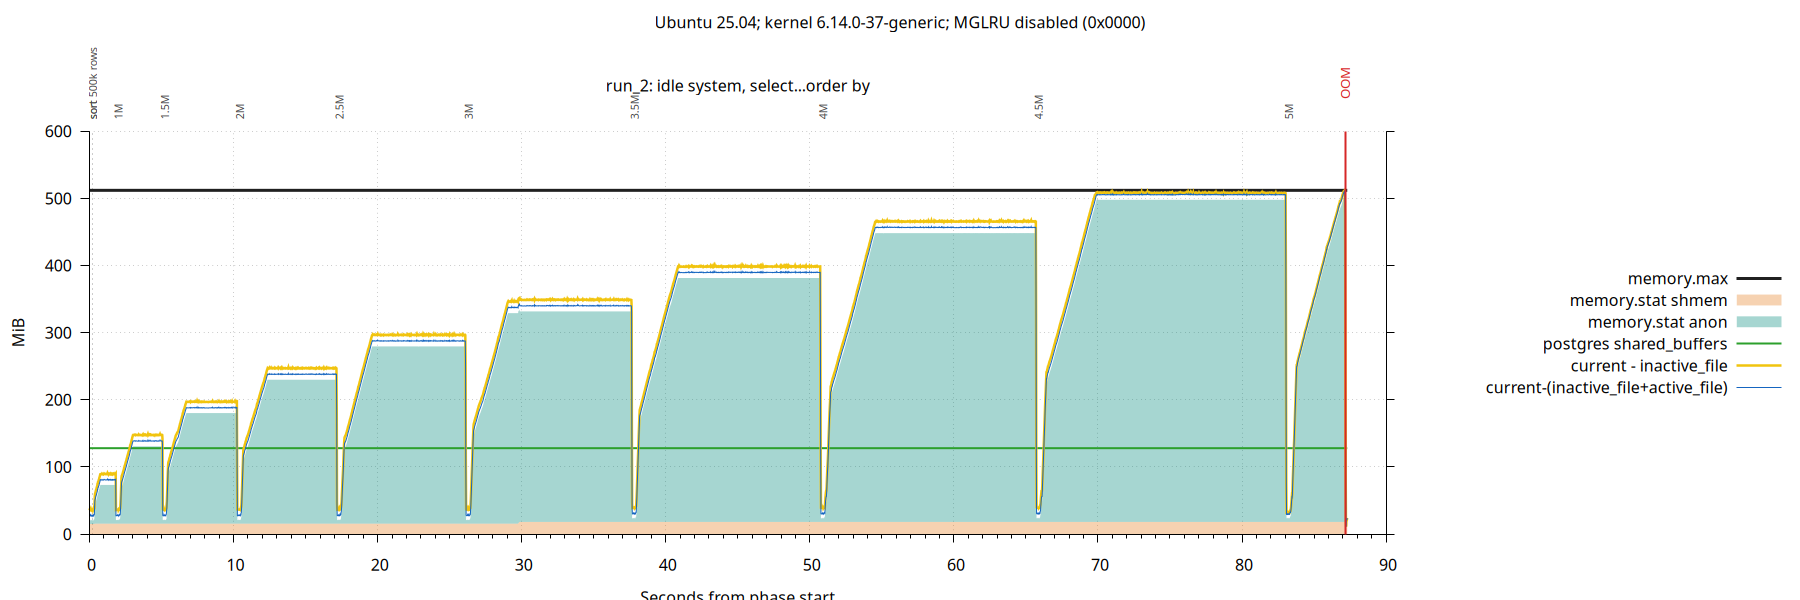
Tracks pretty closely with Kubernetes agnhost. So far, so good. Postgres uses kernel anon memory to perform sorts. It can sort 4.5 million rows, but sorting 5 million rows crashes the database with OOM.
No active page cache.
Postgres Shared Buffers (database cache) are allocated as shmem by the Linux kernel. In this test, Postgres config has 128MB of memory for cache (cf. green line) but the memory has not been allocated by the kernel. This is because we didn’t create any tables.
Enter pgbench – the Postgres hackers best friend. Lets run it in the background while we test ORDER BY statements.
We’ll run the select-only workload and drop the PK from accounts to force full table scans on the accounts table (dropping the PK will also drop the index). We’re going for memory pressure, not TPS.
pgbench --initialize --scale=4

psql -c "ALTER TABLE pgbench_accounts DROP CONSTRAINT pgbench_accounts_pkey"

pgbench --select-only --client=2 --jobs=2
Scale 4 is about 70 MB.

The distance between yellow and blue lines is kernel page cache contents on active file LRUs. We are starting to see a little more.
The linux kernel allocated about half of the Postgres Shared Buffers. They are allocated on demand after startup.
Now the database crashes when sorting only 4M rows (rather than 5M).
We are also starting to see that the page cache has some active pages, not only inactive pages.
This raises a question: are shmem pages reclaimable? What if the database is completely idle and there’s no workload at all – can we release a few of those shared buffer pages to avoid a crash?
To answer that question, stop running pgbench and just create a single large table that we can read into the buffer cache before we start running sorts.
CREATE TABLE shared_buffer_filler AS
  SELECT n, repeat(md5(n::text), 8) AS payload
  FROM generate_series(1, 440000) AS input(n);

CREATE EXTENSION pg_prewarm;

SELECT pg_prewarm('shared_buffer_filler'::regclass, 'buffer');
This 440,000 rows table works out to about 127 MB in size. The prewarm extension is a handy way to load a table into your buffer cache. (Postgres uses ring buffers for some bulk ops to avoid one operation evicting everyone else from the cache; I’m using pg_prewarm to explicitly ensure the table is fully loaded to the cache.)
No pgbench – we will simply do this prewarm and then run our sorts.

Now we see the full buffer cache has been allocated. The kernel can never again reclaim shmem – and that means our database will crash when we sort a mere 3.5M rows (rather than 4M).
If you’re running postgres in cgroups with memory.max (aka Kubernetes Memory Limit) then you might want to run with shared_buffers lower than what’s typically recommended.
So far, Kubernetes metric container_memory_working_set_bytes is a good indicator of memory use. Now that we’ve established all of our fundamentals lets look at a more interesting case.
After prewarm, start pgbench with scale 20 for 300 MB (after dropping the 50 MB PK index). Repeat the sort test.
pgbench --initialize --scale=20

psql -c "ALTER TABLE pgbench_accounts DROP CONSTRAINT pgbench_accounts_pkey"

pgbench --select-only --client=2 --jobs=2
Now we break Kubernetes. :)

Same database crash on the 3.5M row sort. But now, the kubernetes metric container_memory_working_set_bytes (yellow line) is not giving a useful indicator of memory use.
Directly inspecting cgroup metrics: shmem reflects Postgres Shared Buffers and anon reflects working memory of SQL queries. When these approach the container limit, we get a database crash (OOM).
Lets take a look at what happens if we reduce the size of the buffer cache.
docker run --name graph-repro-run_2-1821100 \
    --memory 512m --memory-swap 512m --detach \
    --env POSTGRES_PASSWORD=graphrepro \
    postgres:18 \
    -c shared_buffers=32MB
Run exactly the same test.

Kubernetes container_memory_working_set_bytes is actively misleading. The system looks like it has more memory pressure, but really it has less. Now we can sort 4M records without crashing (instead of 3M).
Active pages in the linux page cache are easily reclaimed under memory pressure. If we want a reliable metric, the simplest and best route is to ignore the page cache entirely (blue line), rather than only ignoring inactive pages (yellow line).
When I find a few more minutes, I’ll show how to add this corrected memory utilization metric with CloudNativePG. Basically, you simply add the pgnodemx extension (https://github.com/pgnodemx/pgnodemx/) then write a CNPG custom monitoring query that does the correct calculation from the cgroup metrics. I’ll also try to find time to run everything against a full kubernetes environment in a production configuration – confirming the patterns hold.
Linux’s new Multi-Gen LRU changes everything. It seems to be enabled by default on the latest Debian and Ubuntu LTS releases. I’m not sure if people are enabling it in Kubernetes systems yet.
Here are the last two tests repeated with MGLRU enabled:


With MGLRU, Linux represents the two youngest generations as “active” and my system had min_gen=2 and max_gen=4. Linux seemed much less prone to have pages on “active” generations in these tests running on my laptop, but I haven’t spent enough time with MGLRU to know what workloads would make more pages appear as active to Kubernetes.
Memory pressure is a complex topic, especially once swap enters the picture. I think swap remains disabled on many Kubernetes systems, but this might change. PSI is also an important metric for linux memory pressure. This blog is more focused on utilization than pressure.
In Summary: current - (inactive_file+active_file) remains a very useful metric, and I think it should always be collected for Postgres when it’s running on Kubernetes. I would also collect shmem and anon, and maybe samples of top-N resident - shared from /proc/pid/statm which seems cheaper for frequent collection across a large number of processes than RssAnon from /proc/pid/Status.
Postgres Checkpoint Followup and Collation Visualization and Codex Luna
My previous article talked about the checkpoint happiness hint: You probably should not change the checkpoint_timeout setting from its default of 5 minutes.
Checkpoint Followup QuestionsA good follow-up question was raised: can an HA replica can save you from downtime if you want to set a large checkpoint_timeout?
It’s true that Postgres allows promoting a replica without restarting, if there’s an unplanned primary restart and your primary is going to take an hour to come back online (after you increased checkpoint_timeout to 45 minutes). But this glosses over the fact that if the replica experiences a restart, then it will take an hour to start up too. Checkpoints on the primary directly translate into restartpoints on the replica (it’s the same WAL stream).
First case: everything is manually managed by a DBA and there’s little automation. Bugs in the tooling are a risk, but the biggest risk here is human error. As we often say in COE’s: people make mistakes. Hoping they won’t make a mistake is not a realistic plan for a reliable platform.
Second case: postgres is increasingly automated and we need to be careful that our automation doesn’t accidentally restart a replica while we’re promoting it.
Even with automation, common Postgres orchestration kits heavily rely on “the DBA knows how to configure it” (ie. you still can’t trust all of the defaults). One example: PG configuration changes require rolling restarts. Is the default behavior of common orchestration frameworks to continue a rolling restart even if the first node never comes back up? Are we back to the first case of relying on the DBAs to know the specific incantation of special commands they need to run, to ensure they never accidentally end up restarting both nodes? If the rolling restart can’t complete, will the DBA know how to address it without accidentally triggering a restart in any way?
And what if a query is triggering a postgres bug which causes a restart – like consuming enough memory to trigger OOM? This is rare, but it certainly isn’t unheard-of. In this case there’s really nothing we can do – the workload will trigger restarts of both nodes and we still have the extended outage, rather than getting online as soon as we stop the bad query.
Fundamentally, if checkpoint_timeout is being set to a large value, then we’re relying on a hope that whatever causes our primary to restart, doesn’t also cause our replica to restart after we promote it and move our application traffic over.
My opinion remains that it’s best to use database configurations which are as robust and safe as possible – even in the face of software bugs and operator mistakes. This isn’t Postgres-specific – this is how I think about checkpoints across the board with relational databases (SQL Server, Oracle, Db2, etc). The exact purpose of checkpoint tuning in a relational database is directly related to your availability SLOs – it’s for bounding the amount of log replay needed at startup (on both primaries and replicas). The actual startup/replay time can exceed checkpoint_timeout, but this remains the best setting for managing your availability SLO in Postgres.
Postgres CollationI have a major update on the Postgres Collation front.
Background:
- In 2018 glibc 2.28 shipped with significant changes to sort ordering. As a result, a bunch of Postgres DBAs accidentally corrupted their databases by upgrading their operating system to RHEL8 / Debian10 / Ubuntu20.04 underneath existing databases. (Note that the same corruption happens when any postgres container image is updated with a newer base image.)
- I was working at AWS and became involved early-on with finding a solution for Amazon RDS and Aurora (AWS manages the infrastructure underneath RDS Postgres). The scale of Amazon’s customer base made this an incredible place to learn. I learned more about Linux and Postgres collation than I ever wanted to know <g> … which was shared in a 2024 pgconf.dev talk.
- Based on what I learned, I developed a specialized list of 25 million strings which could find changes in sort order across many languages and locales. The 91 patterns were shared in my glibc-unicode-sorting GitHub repository in 2021. We nicknamed it the “Collation Torture Test”
- Using that list of 25 million strings, I looked at 10 years of history across RHEL, Ubuntu and Debian and I discovered that changes in sort order had been happening for many years – largely unnoticed by Postgres Developers and DBAs. There were even a couple corruption reports on the mailing lists which hadn’t been fully root-caused. This was also shared in the 2024 pgconf.dev talk.
So what’s new? A few things:
- Joe Conway built on this work, and he had the idea to generate a checksum on the sorted list as a fingerprint of the sort order for a platform. Initially, one driver was wanting to have a validation test running regularly in CI pipelines to give high confidence that sort orders are not changing. But a fingerprint can be useful for many things. Joe presented about this at a few conferences including PGCon 2023.
- My RHEL/Ubuntu/Debian tests needed to be updated over time with new releases, and I am always behind. Magnus Hagander suggested the idea of leveraging containers to make it easier to run these tests and validate new OS releases faster.
Last week I finally found the time to sit down with this. The Collation Torture Test has now been fully ported to docker and GitHub Action workflows. Using Joe’s idea, I also pivoted from drill-down data to fingerprints – and I have generated fingerprints across more platform combinations than ever before. And my favorite part is an idea I had last week – using colors to visualize the fingerprints across a grid of languages and OS versions. It’s now possible to visually compare sort orders at a glance across all of the combinations.
It makes patterns a lot easier to see!
- ICU sort order changes for every language in every release
- GNU C Library sort order for Korean and C collation changed in Debian 12 and RHEL 9
- English and French have always had identical sorting
- Starting with Debian10/RHEL8, German and Russian match English and French. In Debian, Arabic also matches – but Arabic has some kind of special treatment in RHEL and it has never changed.
- Japanese sort order has somehow never changed on either Debian or RHEL
The performance is also very interesting. In the tables I also record how long the SELECT ... ORDER BY SQL statement took – which tells us how performant the sort is. Version 2.28+ of glibc is a performance disaster. German, English, French, Spanish, Russian, Arabic and Chinese all skyrocket to 2 hours for sorting these 25 million strings. Only Korean, Japanese and C sorting remain performant. (And RHEL’s special version of Arabic stays performant.)
Explore for yourself: https://github.com/ardentperf/glibc-unicode-sorting/
One final thing – I now have a GitHub Actions workflow which will automatically run every two weeks and tell me any time a checksum changes on Debian SID. This provides a real-time indicator of changes coming in the future. There is a badge above the tables and if the badge is green then you know the Debian SID columns in the tables are accurate.
 OpenAI Codex and Luna
I used this Collation Update Project as an opportunity to experiment with Luna. A Seattle friend working at OpenAI told me I’m the only person he knows who’s going all-in with “Luna-Low” right now <lol>
(Sol is Codex’s most powerful model for complex tasks, Terra is its balanced everyday model, and Luna is its lightweight option. Think: Opus/Sonnet/Haiku. I’m also running with “Low” effort, which is the lowest effort setting available.)
I switched to Codex recently after I stopped trusting Anthropic. I was doing some Postgres work and suddenly all my sessions started hitting security guardrails and refused to continue working on the project. I wasn’t doing anything remotely related to security but I had a lot of postgres source code in the context window and something started tripping the guardrails. (I was reproducing a bug where postgres follows the wrong fork on a timeline change while replaying WAL.) I tried the buttons to ask for review but probably its just some AI agent reviewing anyway, and it never led anywhere. So I quit Claude and went to Codex. I don’t fully trust OpenAI either but for now they seem less likely to shut me down in the middle of a project for bogus reasons without any remediation.
With both Claude and Codex, I’ve had my share of “take my money” and I’ve had a couple expensive months doing cool projects. But I wanted to try out the other approach: how much mileage can I get without spending hundreds of dollars?
Enter Luna.
The pricing on Luna is insanely low. I run my agents YOLO on an isolated VM with their own creds. I think this collation update project was similar complexity to a few benchmarking projects I recently did on the higher-priced plans with models like sonnet & opus. With Luna-Low-Effort, my agent loops don’t run quite as long before coming back for discussion – but the flow worked for me during this project. I found Luna to be shockingly capable. It didn’t go off in weird directions or make any big mistakes to speak of (i’m sure my prompts play a role too).
End result: on a $20 plan with Luna, I completed a project of comparable complexity to what I previously spent hundreds of dollars to complete.
The per-token-pricing difference between Luna and Terra is massive. There were a couple times I jumped over to Terra or Sol for just one or two questions. I don’t think I needed Sol, and just a couple questions start consuming my quota noticably faster… but in hindsight I think I can probably avoid Sol and use Terra very rarely.
Right now, I’m 2 days in to my weekly quota. Token-monitor says today I have 71 million tokens to Luna for $1.99 and 5 million tokens to Terra for $1.78 (API rates don’t directly apply to subscriptions, but it’s hopefully an informative rough proxy for quota consumption rates). With a $20 Plus subscription, I still have 95% left on the 7-day limit. Shocking mileage out of a $20 subscription.
Example gpt-5.6-luna high Prompt: start a new branch based on latest gh main. we will now create one final set of tests named builtin. it will need a tsv, a dockerfile and a workflow. for this test we choose architecture and locale and version of postgres. (no engine selection, no os selection.) aarch64 and x86_64. pg versions 14 to 19. locales C, ucs_basic, pg_c_utf8 (17+), pg_unicode_fast (18+). double check that i have versions right for locales. use debian 13 as base container. model everything after existing debian and rhel scripts. test locally with act. run all combinations locally to populate the TSV file. continue debugging any issues until you have all TSV values successfully and have done a full matrix run in ACT that completed successfully with matching expected checksums. then add a table into the README after the rhel tables with postgres versions as colums and locales as rows.
First turn ran for about 98 minutes and used:
- 447 top-level calls – 319 exec orchestration calls, 128 wait calls
- 134 shell commands, 157 stdin polls, 20 patches, 5 web calls, and 4 plan updates
- 1 context compaction
- 66,150,735 input tokens and 78,522 output tokens, including 35,082 reasoning tokens
It delivered a complete, working solution correctly identifying core dimensions and main objective.
I forgot to prompt to offer aarch64 as an option, but not to run any tests – so it tried to test aarch64 (didn’t work locally on my x86_64 laptop). It incorrectly thought ucs_basic wasn’t available in oldest PG versions (easy fix). It made a small error in code conflating POSIX and C collation, which I would not have caught without careful review (these often give identical results – but not always – so just running some tests is not sufficient). I refined the way it built its matrix for a more maintainable approach – dynamic instead of static list. Originally the table had PG versions in ascending order, I switched to descending so that recent versions are more visible.
My $20 plus subscription weekly quota might have gone down by 1%
Overall, a resounding success. I’m excited about how much can be done on a low-cost subscription with the latest models!!
Happiness Hint: Alarm on Checkpoint Time
Before starting, I want to put a few things at the top:
- You probably should not change the
checkpoint_timeoutsetting from its default of 5 minutes. Users who read tuning advice on the internet (or get bad AI advice) about increasing this setting usually don’t understand the risk and significance of trading for RTO/availability. Let’s be honest: many of us don’t scrutinize RTO until we have a real incident and suddenly realize that there is no way to get our application back online. Turns out it does matter to your boss if you’re down! Increasing this parameter can turn a short outage into a long multi-hour outage. - Always make sure
log_checkpointsis enabled. This has been the default since Postgres v15. - With a default checkpoint_timeout setting of 5 minutes, I’m leaning toward a default alarming threshold of 15 minutes on total checkpoint time. You may need to increase disk hardware specs or optimize database workload, if checkpoints take too long.
- There are two ways this alarm can be built – either by parsing checkpoint messages after they appear in the log, or by looking at the current time and checking how long since the last checkpoint message appeared. The latter is a more robust solution because it will alarm even if no checkpoint message is ever produced.
- Don’t forget to also monitor for “checkpoints are occurring too frequently” messages in the Postgres log. In some cases, you might consider increasing
max_wal_sizeif checkpoints are frequent. Remember that it’s ok if there are short occasional bursts of write activity. (It’s also completely ok – even healthy – if disks have bursts that hit the peak IOPS.) The thing to watch for is real user & application impact due to extended throttling.
Checkpoint is the heart of your database. It’s buried deep inside. It’s not something everyone talks about, like well-tuned autovacuum or fast queries. But if checkpointer stops beating, then you’re dead.
In addition to its well-understood job of getting dirty pages written from cache to disk in the background, it also has many smaller jobs that are less widely known. Management of a few shared-memory config settings like sync_standby_names and full_page_writes. Fsync batching. Deferred file unlinks. Enforcement of archive_timeout.
A few years ago, I added a happiness hint to have an alarm on the “time since latest checkpoint”. This was partly due to an incident I saw many years ago but which I never managed to blog about. I saw another checkpoint related incident recently, so I thought I’d gather these thoughts together. Both incidents reveal an important lesson in hindsight: it’s dangerous to restart a database when there are checkpoint problems.
The First IncidentLets see what I can remember about that original incident. It was an ugly 40 hour production outage that happened back in the postgres version 12 era. Someone started getting errors and restarted their postgres database to try to remediate, and the database simply never came back up.
I remember that there were four different things which all combined to make this incident so bad:
- The workload made heavy use of unlogged tables. It created and dropped tables at a high rate.
- Somehow there had not been a successful checkpoint on this database for a week. There was insufficient data to figure out why, after we finally got the system back online.
- Remember that one job of checkpointer is to handle deferred file unlinks. Over the course of the week, while checkpointer was stalled and never unlinked any of the underlying files for the
DROP <relation>statements, the system accumulated 27 million files on the filesystem until it ran out of inodes (before the database was restarted). - The database was on a large server and had a reasonably large buffer cache. In Postgres, any time a relation is dropped, the entire buffer cache is scanned to remove blocks belonging to that relation. (Some other databases maintain an index type of structure for this but Postgres does not.) This includes unlogged tables and their indexes.
- When Postgres starts, the first thing it needs to do is replay write-ahead logs starting at the last successful checkpoint. This database needed to replay more than twenty-five thousand WAL files.
The reason the database never came back up was that WAL replay proceeded at a crawl (due to buffer cache scans), and after running for many hours it would inevitably cause the system to run out of inodes again. It would crash before it could complete recovery. When it restarted again, it lost all progress and went back to the beginning.
Eventually we shrank the buffer cache to speed up replay, but recovery was still incredibly slow – and at the end of the day, as stated above, this ended up being almost two days of production downtime.
At the root of this was a severely lagging checkpointer.
The Second IncidentThe next incident was more recent and involved a hot standby instance, and a multi-hour outage for that hot standby instance. This time it was a CloudNativePG database running on Kubernetes – but similarly to before, the application was experiencing problems and a database restart was triggered as an early remediation. The hot standby instance never came back up.
Again, a few different factors combined to cause the incident:
- The workload on the primary experienced a significant increase in write activity. This was running on cloud infrastructure and the underlying disk flatlined at its maximum IOPS with 100% writes. Hot standby databases had identically configured disks and needed to apply the same write activity as the primary (because they are replicating writes).
- Checkpoints on the primary began to fall significantly behind. Even with a
checkpoint_timeoutof 5 minutes, checkpoints are taking up to an hour to complete and spending the bulk of that time waiting for write IO. (eg.write=2550s, total=3130s). - From an initial pass of postgres recovery code, I think that a replica doesn’t write its first restartpoint until it encounters its second checkpoint record in the WAL stream. Reference
CreateRestartPoint()inxlog.cwhere it says(!XLogRecPtrIsValid(lastCheckPointRecPtr) || lastCheckPoint.redo <= ControlFile->checkPointCopy.redo) - Because of the overloaded checkpointer, when the hot standby restarted, reaching the second checkpoint from the restartpoint required replaying ~328 GB total. The WAL records are generated by many connections in parallel, but crash recovery needs to replay the records single-threaded… so it usually takes longer to replay WAL logs than it took to generate them.
- CloudNativePG was configured with a 60-minute startup probe timeout which would kill and restart the pod if it didn’t open for queries within that time. With the disk I/O still saturated, it was unreachable. This produced a loop: the standby was killed at 18:11, 19:11, 20:11, 21:11, 22:12, 23:12, 00:12, 01:12 — eight restarts. Every hourly session decoded the same 128.6 GB of WAL, preserved none of it across restarts, and terminated at the same position.
I’ve drafted a proposal for a CNPG fix, but again – at the root of this was a severely lagging checkpointer.
Illustrating a Lagging CheckpointerWhat does a lagging checkpointer look like? Lets look at some real examples of healthy and unhealthy systems.
For these examples, I’m using the following LogQL query:
max_over_time({namespace="<my-namespace-with-single-cnpg-cluster>"}
   |~ `checkpoint complete`
   | regexp `write=([0-9]+\.[0-9]+) s, sync=([0-9]+\.[0-9]+) s, total=(?P<total_duration>[0-9]+\.[0-9]+) s`
   | unwrap total_duration [$__auto])
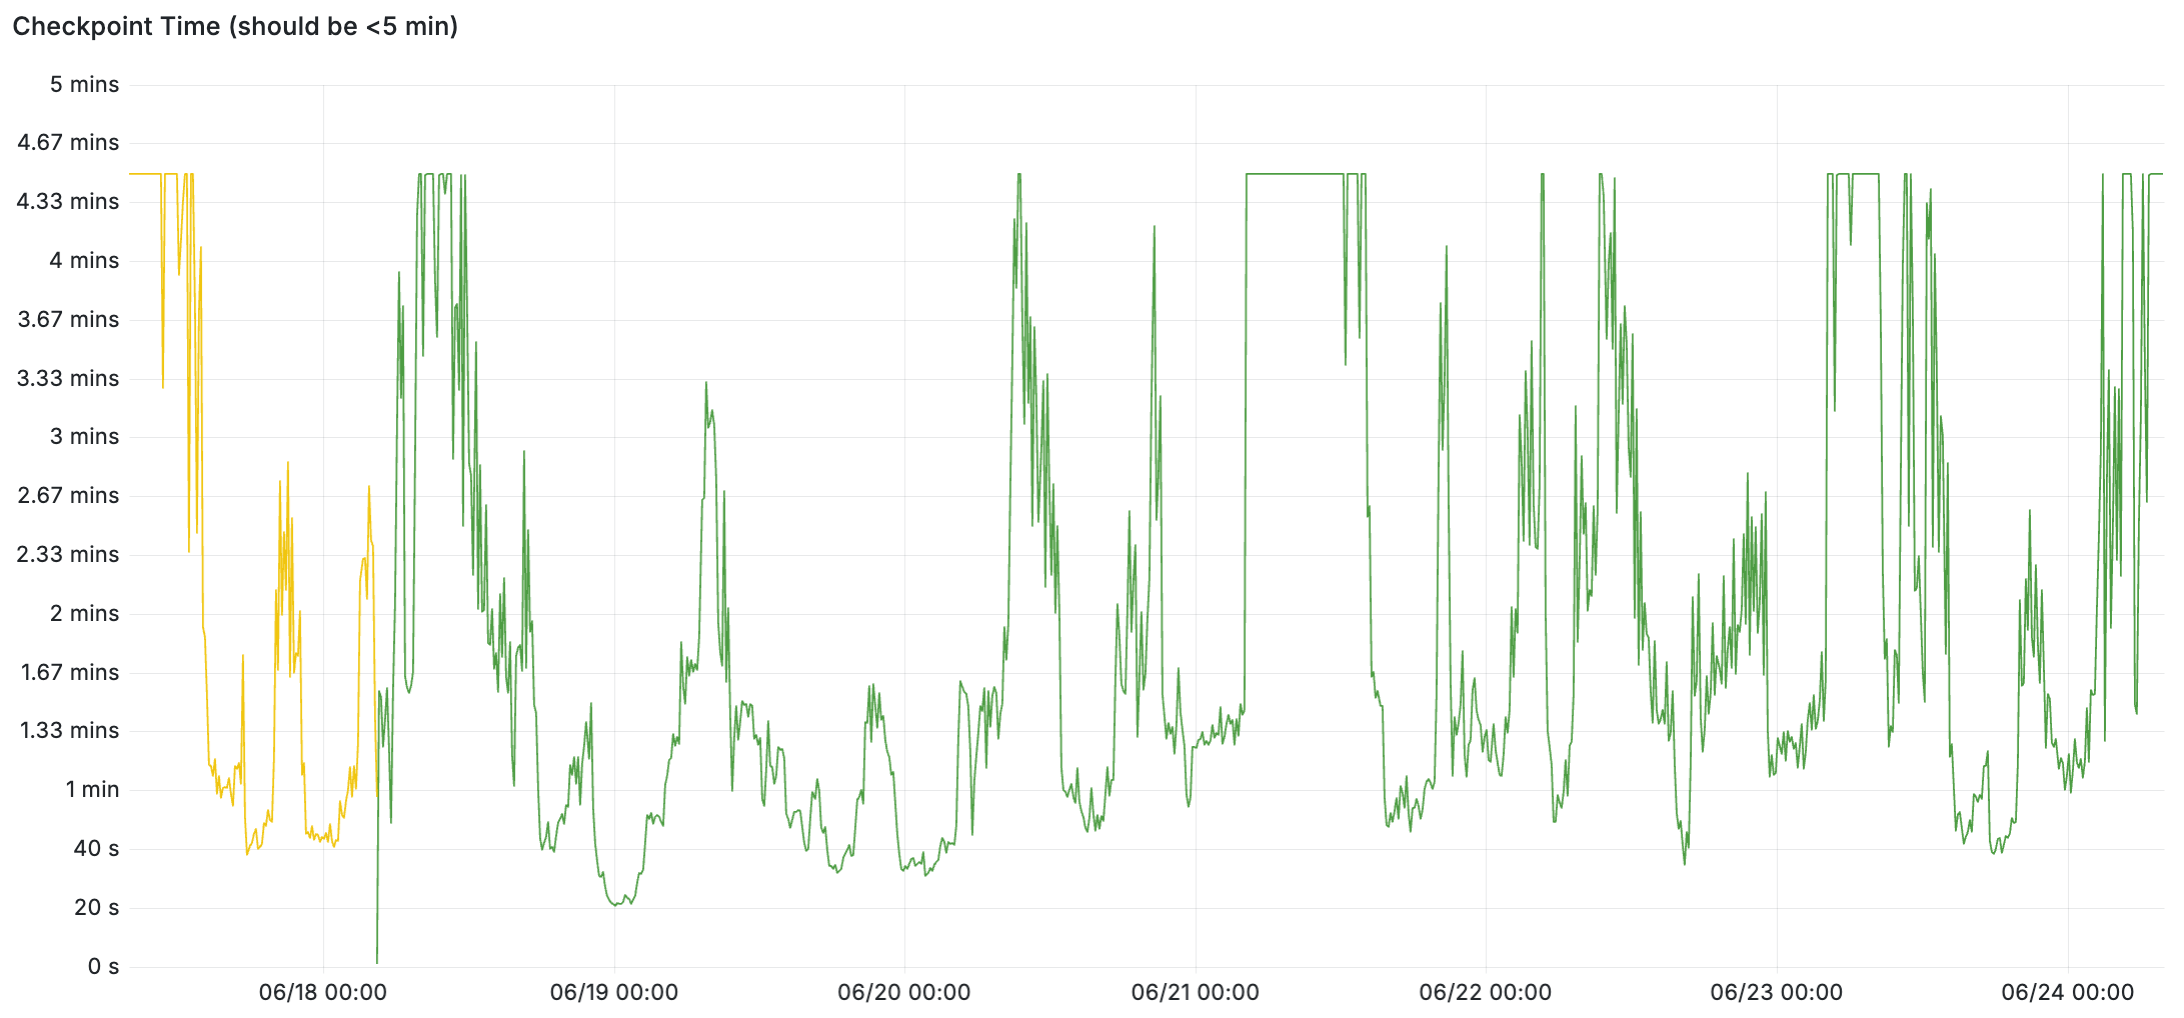
We’ll start with an example of a healthy system. Checkpoints complete quickly when it’s idle, and under load the checkpoints appear to use the full 5 minutes (between writes and syncs) – and the checkpoints are keeping up and not exceeding 5 minutes.
Here’s a LogQL query to cross-check the total write+sync time. In the healthy example below, I confirmed the total time was always the sum of write and sync – it’s not including any sleep time outside of those which is part of meeting checkpoint_completion_target:
max_over_time({namespace="<my-namespace-with-single-cnpg-cluster>"}
  |~ `checkpoint complete`
  | regexp `write=(?P<write_duration>[0-9]+\.[0-9]+) s, sync=(?P<sync_duration>[0-9]+\.[0-9]+) s, total=([0-9]+\.[0-9]+) s`
  | line_format "wait_duration={{addf .write_duration .sync_duration}}"
  | logfmt
  | drop write_duration,sync_duration
  | unwrap wait_duration [$__auto])
I’d like to dig a little deeper into this; the flat line at checkpoint_completion_target seems suspect to me. I feel like there must be some kind of variable idle/sleep factor somewhere in there, because the load on the system is not a flat line. But I’ll save that for another day.
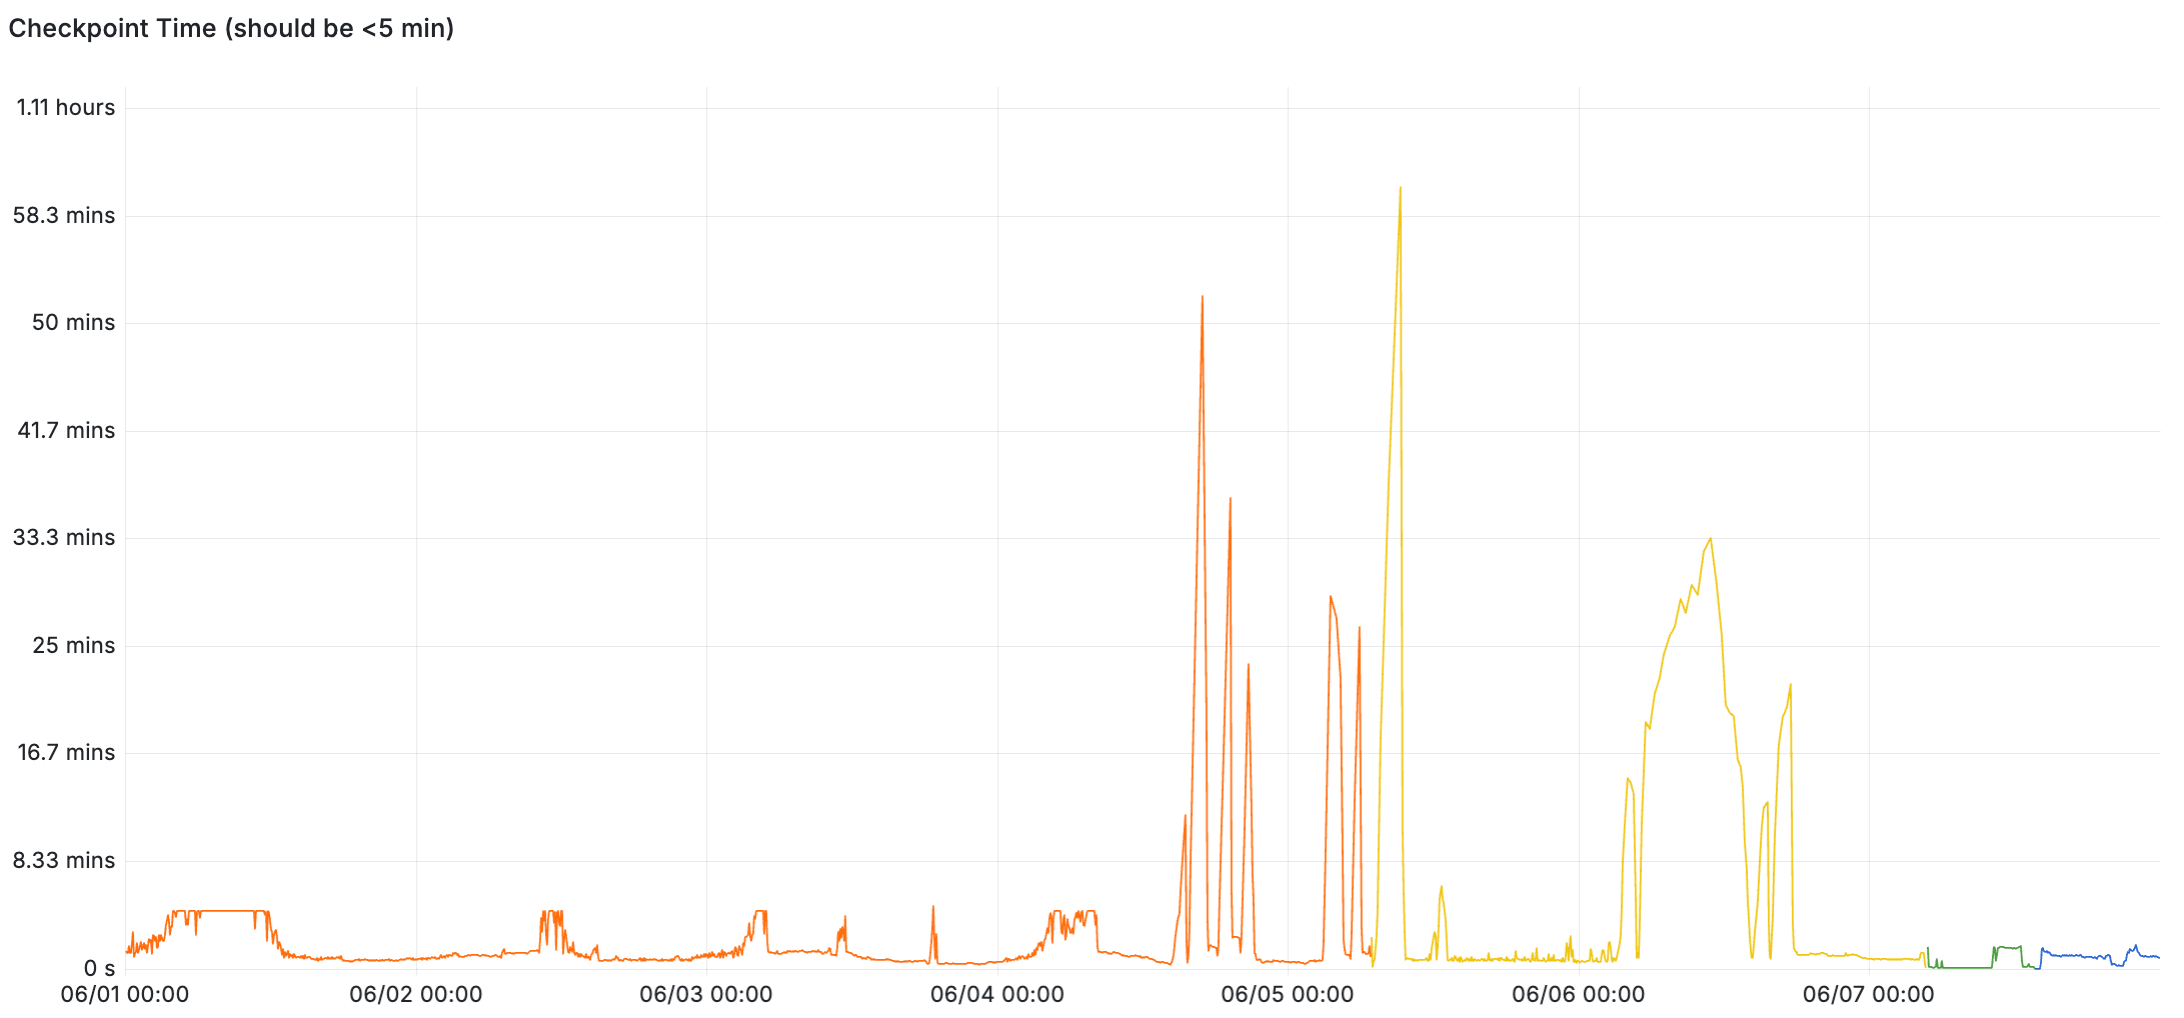
Here’s an example of an unhealthy system. Up until June 4, the checkpoints were completing within five minutes – but once the system gets overloaded, checkpoint times skyrocket up to an hour at times. This example is from the second incident above, where the lagging checkpoint was driven by increased write workload and storage that’s bottlenecked on write IOPS.
And finally, remember: if your database is experiencing a lagging or stalled checkpointer, don’t restart it!
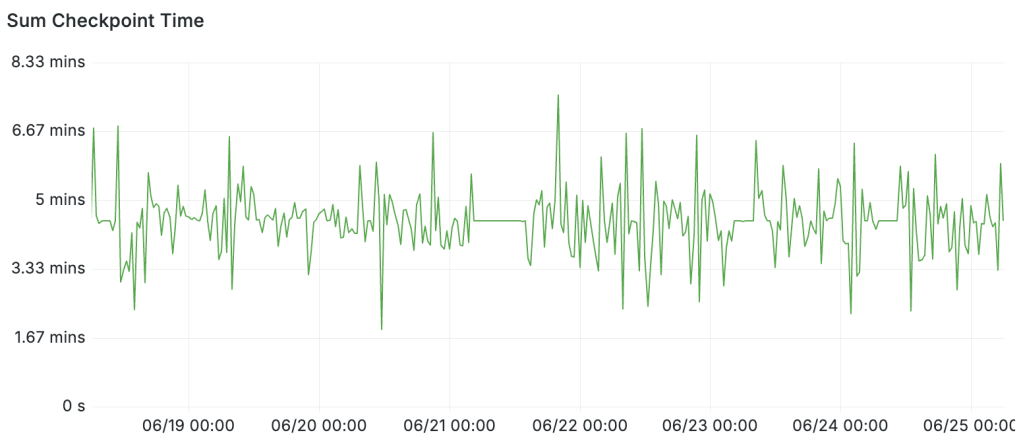
Edit June 24: I figured out why checkpoint time goes to 5 minutes when there’s low activity: the answer is that checkpoint timings absolutely do include idle/sleep time. An email from Andres Freund back in 2019 explicitly described this behavior. Timed checkpoints are always going to have a duration around checkpoint_completion_target and the reason I saw shorter durations is simply because those were requested checkpoints rather than timed checkpoints. The following query makes it pretty clear by adding up the total checkpoint time in every 5 minute window:
sum_over_time({cluster_name="$cluster", namespace="$namespace"}
  |~ `checkpoint complete`
  | regexp `write=([0-9]+\.[0-9]+) s, sync=([0-9]+\.[0-9]+) s, total=(?P<total_duration>[0-9]+\.[0-9]+) s`
  | unwrap total_duration [5m])
PGConf.dev 2026 Trip Summary
I’m back home from Vancouver. What a great week – in every way. I’ll try to share a few highlights here.
Updated Happiness Hints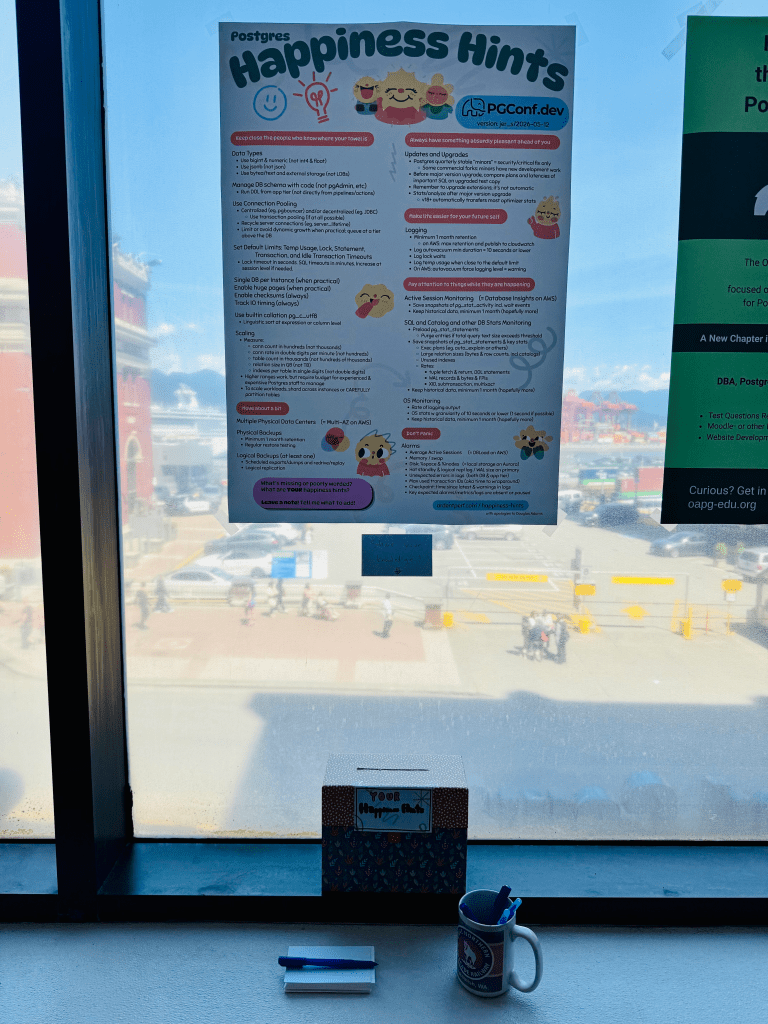
First and foremost: after many years, the Happiness Hints have received a major update! Before the conference, I updated the hints based on all the feedback I’ve collected over the past few years. Then the hints were updated into a poster format and we printed it as part of the pgconf.dev poster session. Throughout the week, I continued collecting more feedback. I used a sharpie during the conference and marked up the poster with ideas. Special thanks to Laurenz Albe, David Rader, Sami Imseih, Ryan Booz and Nik Samokhvalov (Nik you weren’t at the conference but a happiness hint resulted from other discussions we’ve had). Of course I’m forgetting more people who gave feedback making the happiness hints better. After coming home from the conference, I incorporated all the notes I had – and the version that’s now published here at ardentperf.com is the latest & best version I’ve assembled so far.
Physical Replication and Postgres High AvailabilityAn extraordinary number of postgres users rely on physical replication for high availability. It’s been around for a long time and it works well. Nonetheless, there are a few rough edges and over the years there have been various mailing list threads that haven’t fully been resolved.
I proposed a Friday unconference session on this topic, and the topic received enough votes to be selected. Notes from the unconference are available on the Postgres wiki. But the discussion extended far beyond the unconference; there were also hallway discussions over coffee (thanks Thomas Munro) and then continuing discussions over dinner at Joey Burrard and beers at Steamworks (thanks Ants Aasma).
The first question that everybody asks is “should postgres have more HA capabilities in core”? And a discussion starting along these lines consumed the first half of the unconference.
But I thought the most interesting train of thought was something more incremental – an idea that Postgres is missing a fundamental/overarching concept or first principle which could make a lot of problems easier to solve – a concept around cluster topology. There are a few ways this could look. A function or a view like pg_nodes or something? The ability on a hot standby to query for all of the replicas in the topology? How about a function that could be called on a hot standby when the primary is unreachable and return a list of potential candidates for promotion to be a new primary?
My own idea is to consider the set of nodes in synchronous_standby_names as the “cluster” or “herd” of instances. (Jeff didn’t like the name “herd” but the word “cluster” already means something else in postgres…) Maybe we can let people set the number to “0” if they want a cluster with async replication. Which brings us to another challenge – managing changes to this parameter. First, how do we know the exact moment when every single connection and session is aware of a new set of cluster members? Remember that individual connections are responsible to ensure transactions are replicated before acknowledging commits to clients. Second, how could we ensure that all of the replicas know about changes when adding or removing cluster members?
There are also challenges around logical replication slots (like losing them after two failovers in a row, or the inability to replicate them at all if decoding from standbys) – could a new cluster concept help? A new cluster concept also might help around managing backups of WAL across a cluster. Lots of interesting ideas!
Wait Events and Physical Reads and pg_stat_statementsA handful of short discussions with Sami Imseih and Lukas Fittl. First off, Sami has some patches for pg_stat_statements that I’m pretty excited about. Improving concurrency around the LWLock and looking for ways to optimize the situation with the query text file.
Second, I had a few chats around physical reads. Right now I’m using the pg_stat_kcache extension to get data on physical reads. Postgres itself only tells reads that happen from the OS page cache. There’s ongoing work around direct IO, and also Postgres 18 will get a new AIO feature… and I’m curious if pg_stat_kcache will be able to get data about the background IO workers in pg18. There was some concern around the overhead of calling getrusage() too frequently; some benchmarking would be good, to determine if the overhead is too high to get per-query physical reads from AIO workers. (I’m expecting io_uring to be unavailable in many containerized environments; I think that GKE servers and also Docker’s default seccomp profile disable it.) I wonder if some users will want to disable the IO workers purely so they can continue getting physical read stats.
Third were a few small side conversations on better observability around Wait Events and Locks. For wait events, I think that we should be able to add counters to keep track of the number of times every wait event is called and the total duration for each wait event. But what about LWLock Wait Events? Too much overhead? It turns out that LWLocks don’t register wait events if they can quickly acquire a lock. They only register a wait if they actually relinquish the CPU to wait on a semaphor – so I think the overhead of maintaining counters on waits might be acceptable (and essential for debugging). Separately from this, I think that we also might be able to find a way to count the total number of times each LWLock is acquired – but it would need to be very efficient to be enabled all the time. (Postgres has LWLOCK_STATS already as a build flag but it’s not typically enabled.) I suspect we might want counters that are local to each process, and only aggregate them to central stats at some conservative interval.
CollationIt would hardly be a postgres conference if Jeff Davis and I didn’t have at least one conversation about Collation where we both insist that we’re now retired from collation work, then spend an hour debating how to best move Postgres forward.
Amazing work was done. But also, there is still more work to do.
The big problem nobody’s talking about is that language changes. ICU needs to be upgraded. Linguistic sort order is like time zones. It’s rare, but it changes – and when the sort order changes, all your indexes become invalid. Postgres does not have any good story yet for ICU upgrades.
Postgres now has a builtin stable code-point-order collation (pg_c_utf8). It’s possible to set this as the database default and do your linguistic sorting at the expression or column level. (Which you should! And it’s a happiness hint!) But lets be real: users in non-english languages don’t want to go through their entire schema or application adding COLLATE "fr_FR.utf8" everywhere.
The million-dollar question is “what do users really want?”
Can we come up with some limited “client locale” concept that gives users default behavior according to their client locale, while the database itself (and all indexes) operate with pg_c_utf8 collation? Maybe users only really care about ordering of results? The ORDER BY matters to them, but they actually might not really expect or care about the less-than operator? I think the ideal behavior is somehow that indexes are always created with pg_c_utf8 collation, while users can have a good experience that doesn’t require adding COLLATE clauses everywhere. The challenge is how to figure a way that pg_c_utf8 indexes can be used most of the time.
FWIW, Oracle takes a very interesting (if pragmatic) approach here – they just list all the operators, and some default to binary/codepoint collation while others default to the client locale. (Of course collation can always be explicitly specificed; this is just for defaults.) Indexes are always created binary/codepoint and indexes are generally used by queries. In Postgres, could the bttextcmp() function in postgres be tweaked somehow so that it can use pg_c_utf8 indexes by default even when the user requests linguistic collation? Or could we look at query execution plans and only apply linguistic collation to top-level nodes somehow? Crazy ideas, not sure any of it works, we’re still brainstorming.
Lightning Talks and Dinner GroupsTwo final brief mentions. This year, Masahiko Sawada and myself organized the Lightning Talks. First time I’ve done it. We mostly just followed the same process which had been used last year – there was a very helpful google doc which we followed (and updated). From 29 total submissions, we randomly chose 12. Four people used green cards to indicate new/inexperienced speaker and we made sure that 2 of those were included. Every speaker gets 5 minutes max!
I learned that originally, Lightning Talks at pgcon were first-come-first-serve. As the conference grew, the Lightning Talks switched to random selection. Submissions were done at the conference by putting a note card into a box with your name and topic. I overheard a little discussion on Friday around whether lightning talks should move to a model of online submissions in the future, maybe ahead of time, more like a real CFP with a selection process instead of purely random selection.
I’m new here, but I do think there’s something that feels a little more authentic when it’s a physical submission at the conference and a random selection. Fits with the theme of this conference – ample time for hallway discussions and impromptu topics. Online submission feels a bit different; there are pros and cons both ways.
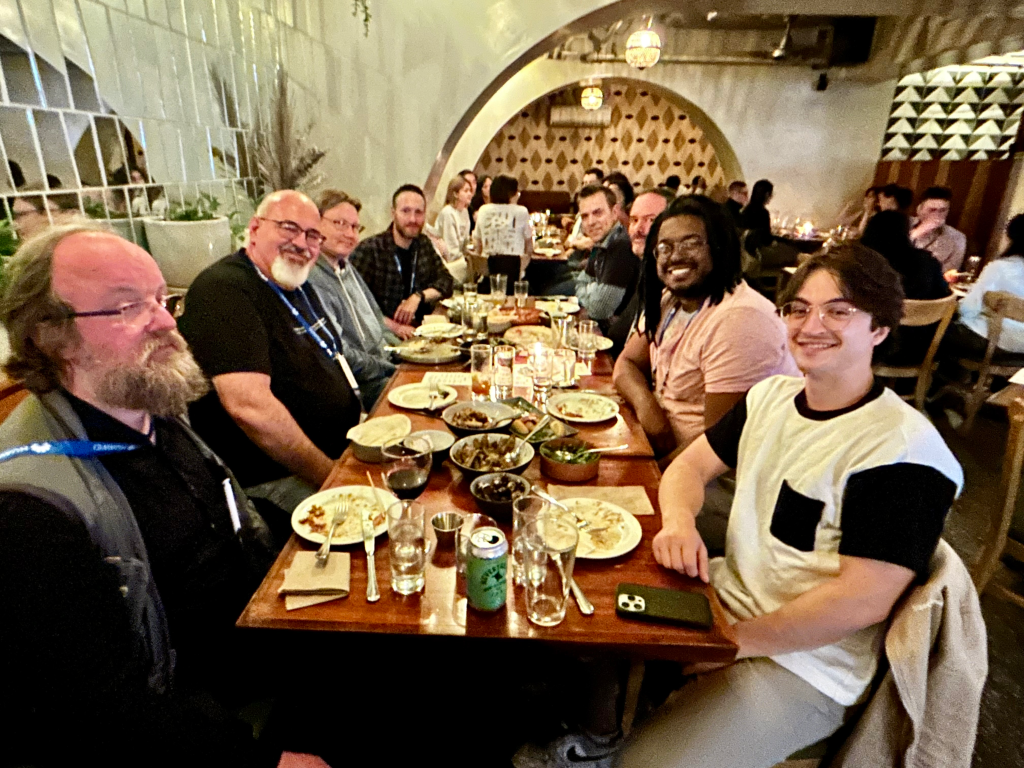
One final thing this year was that Paul Ramsey organized dinner groups on Tuesday and Thursday. What a fantastic idea! I was part of dinner groups on both days and really enjoyed meeting new people and having some great conversations. I forget to get a picture on Thursday, but here’s the group from Tuesday.
I wasn’t originally planning to attend this conference – and I’m very glad that I decided to go. I hope I’m able to attend another pgconf.dev in the future!
Zero autovacuum_vacuum_cost_delay, Write Storms, and You
A few days ago, Shaun Thomas published an article over on the pgEdge blog called [Checkpoints, Write Storms, and You]. I left a few comments [on LinkedIn]. This article is a great technical read about an important and overlooked topic – and I always love seeing real test results to illustrate the details.
I don’t have any reproducible real test results today. But I have a good story and a little real data.
Vacuum tuning in Postgres is considered by some to be a dark art. Few confidently say: “Yes I know the right value for autovacuum_vacuum_cost_delay.” The documentation gives guidance, blog posts give opinions. Eventually I thought, “Ok what’s the worst that could happen if this one was set to zero?”
The story starts with some unexplained, intermittent application performance problems. We were doing some internal benchmarking to see just how far we could push a particular stack and see how much throughput a specific application could get. Everything hums along fine until suddenly – latency would spike across the board and the application would choke, causing backlogs and work queues to blow up throughout the system.
Where do you start when you have application performance problems? Wait Events and Top SQL – always! I’m far from the first person to evangelize this idea; I’ve said many times that wait events and top SQL are almost always the fastest way to discover where the bottlenecks are when you see unexpected performance problems. My [2024 SCaLE talk about wait events] gets into this.
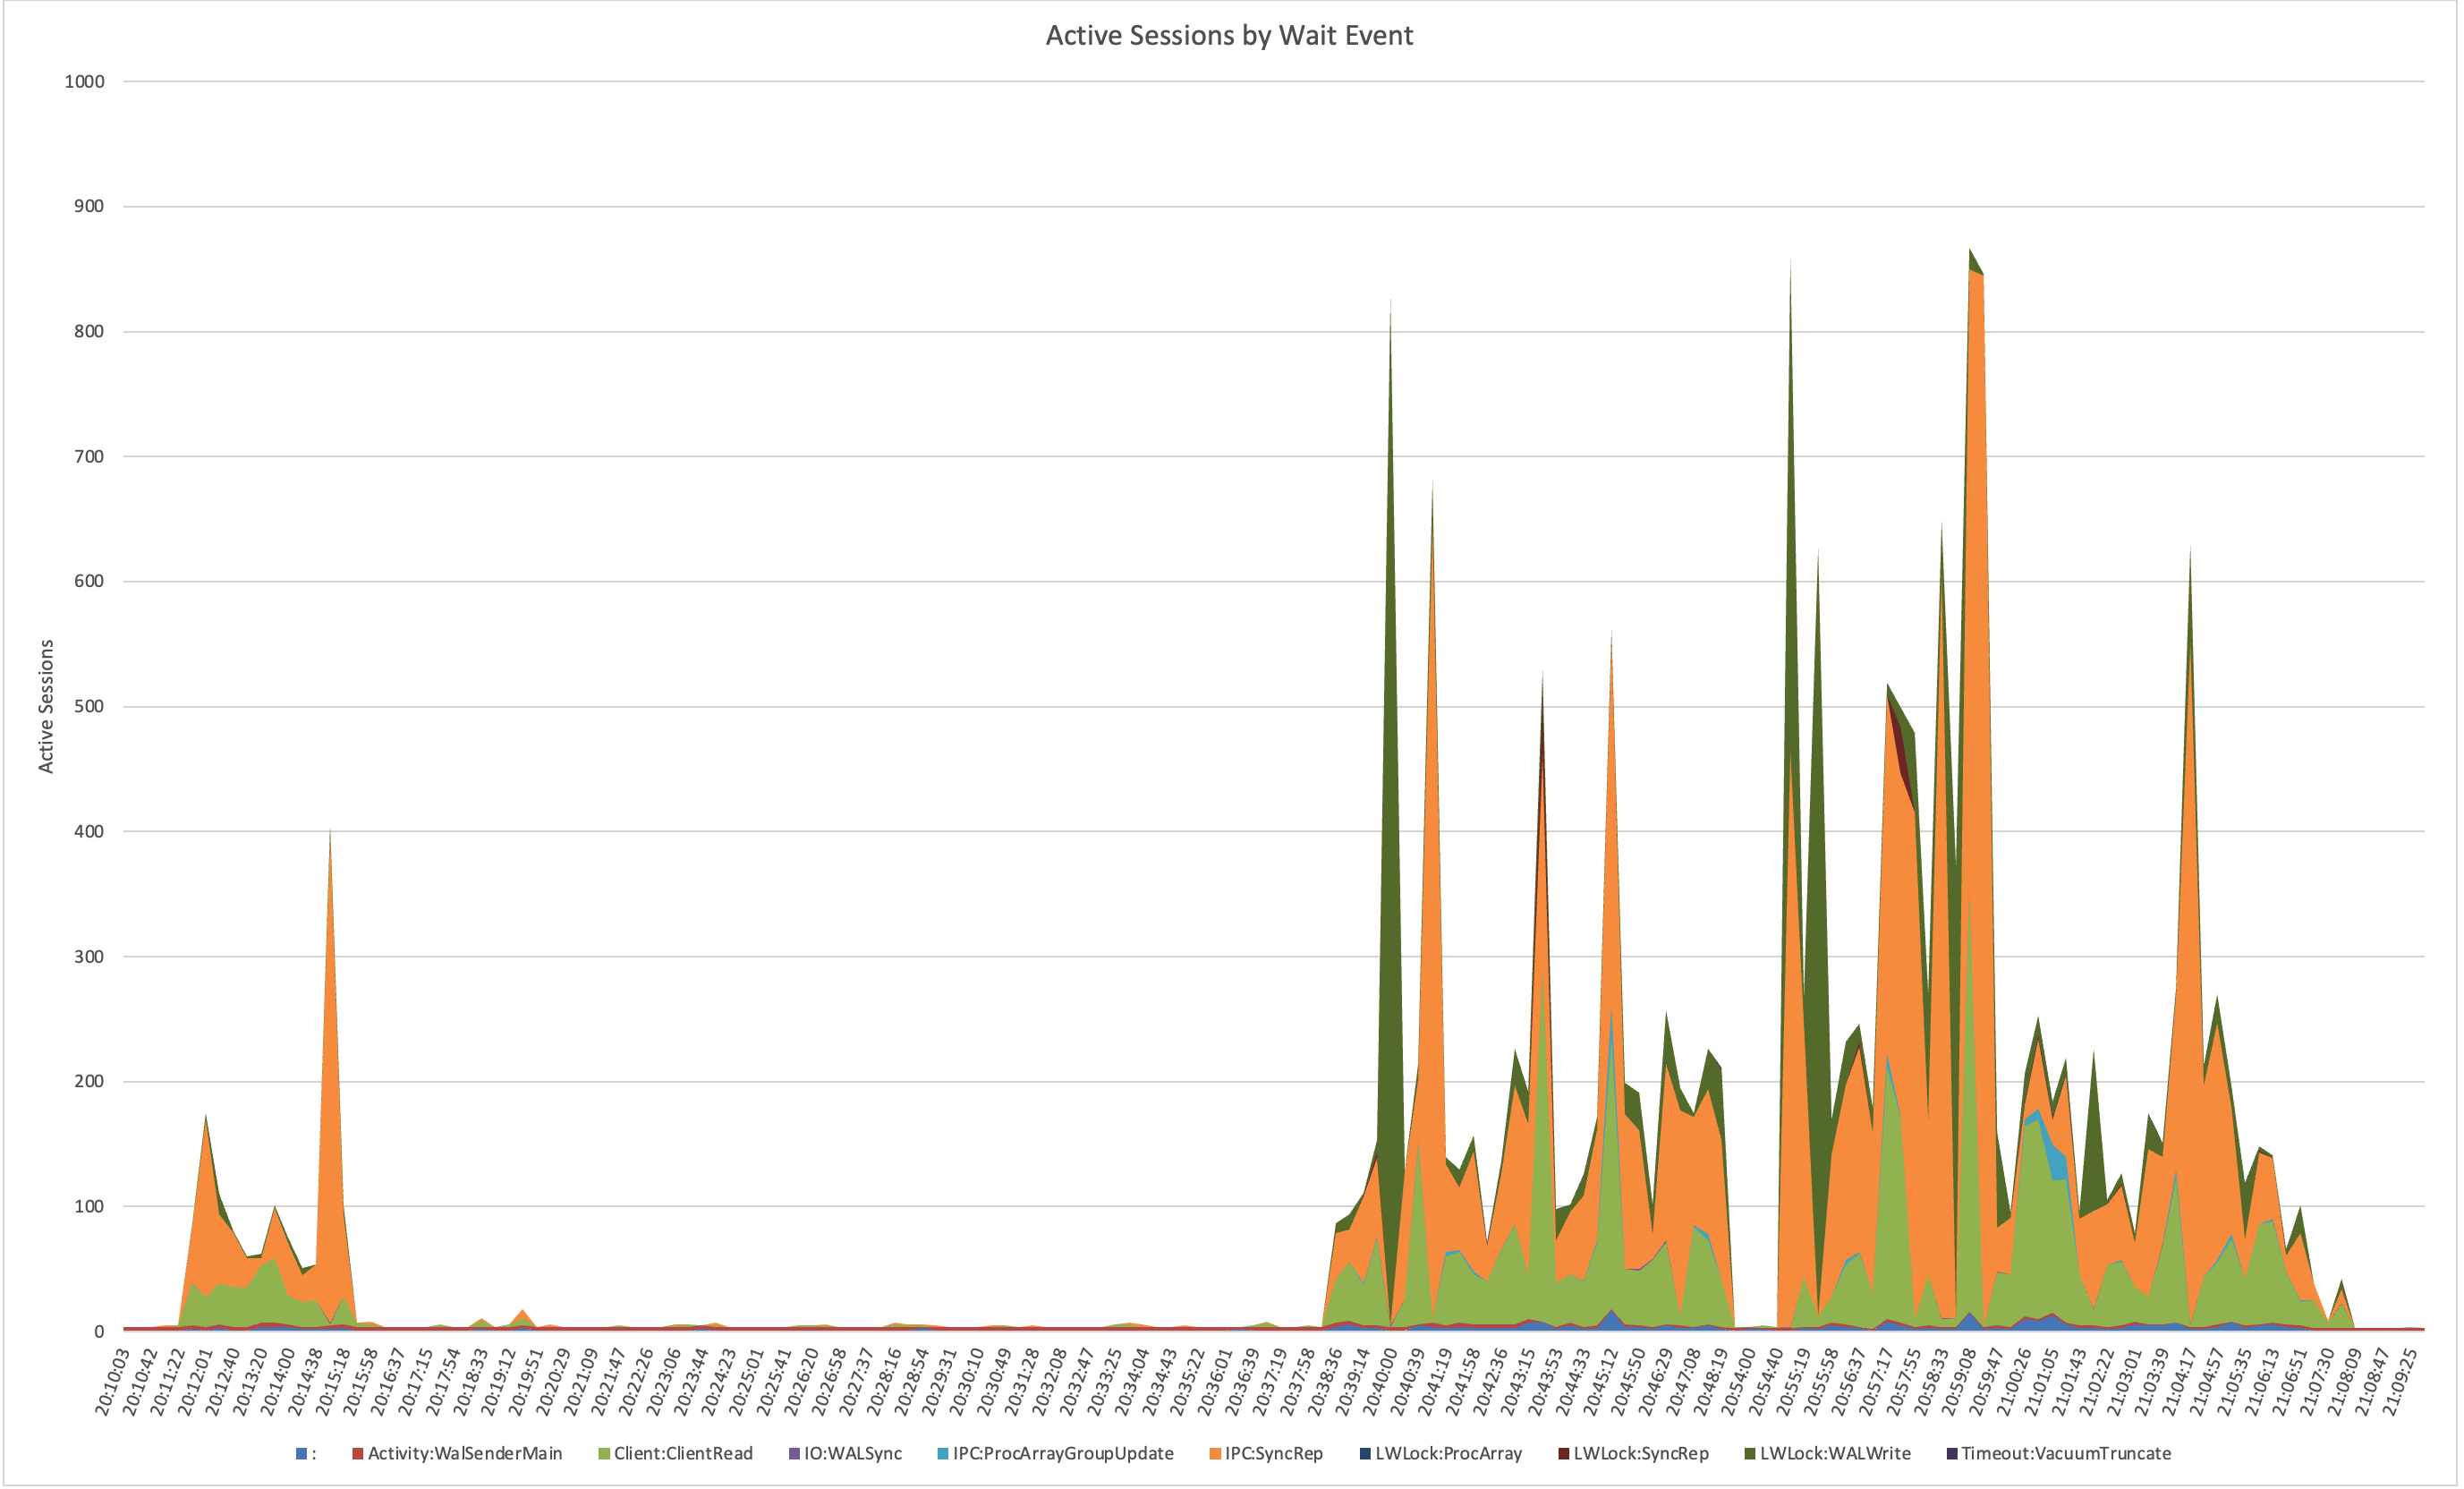
So naturally I dug into the wait events and top SQL – and I noticed these slowdowns lined up perfectly with spikes in COMMIT statements on IPC:SyncRep waits. This wait event is not well understood. Last October I published an article [Explaining IPC:SyncRep – Postgres Sync Replication is Not Actually Sync Replication] with more explanation – but essentially it means the replicas were lagging behind and the primary was blocking on commit acknowledgments.
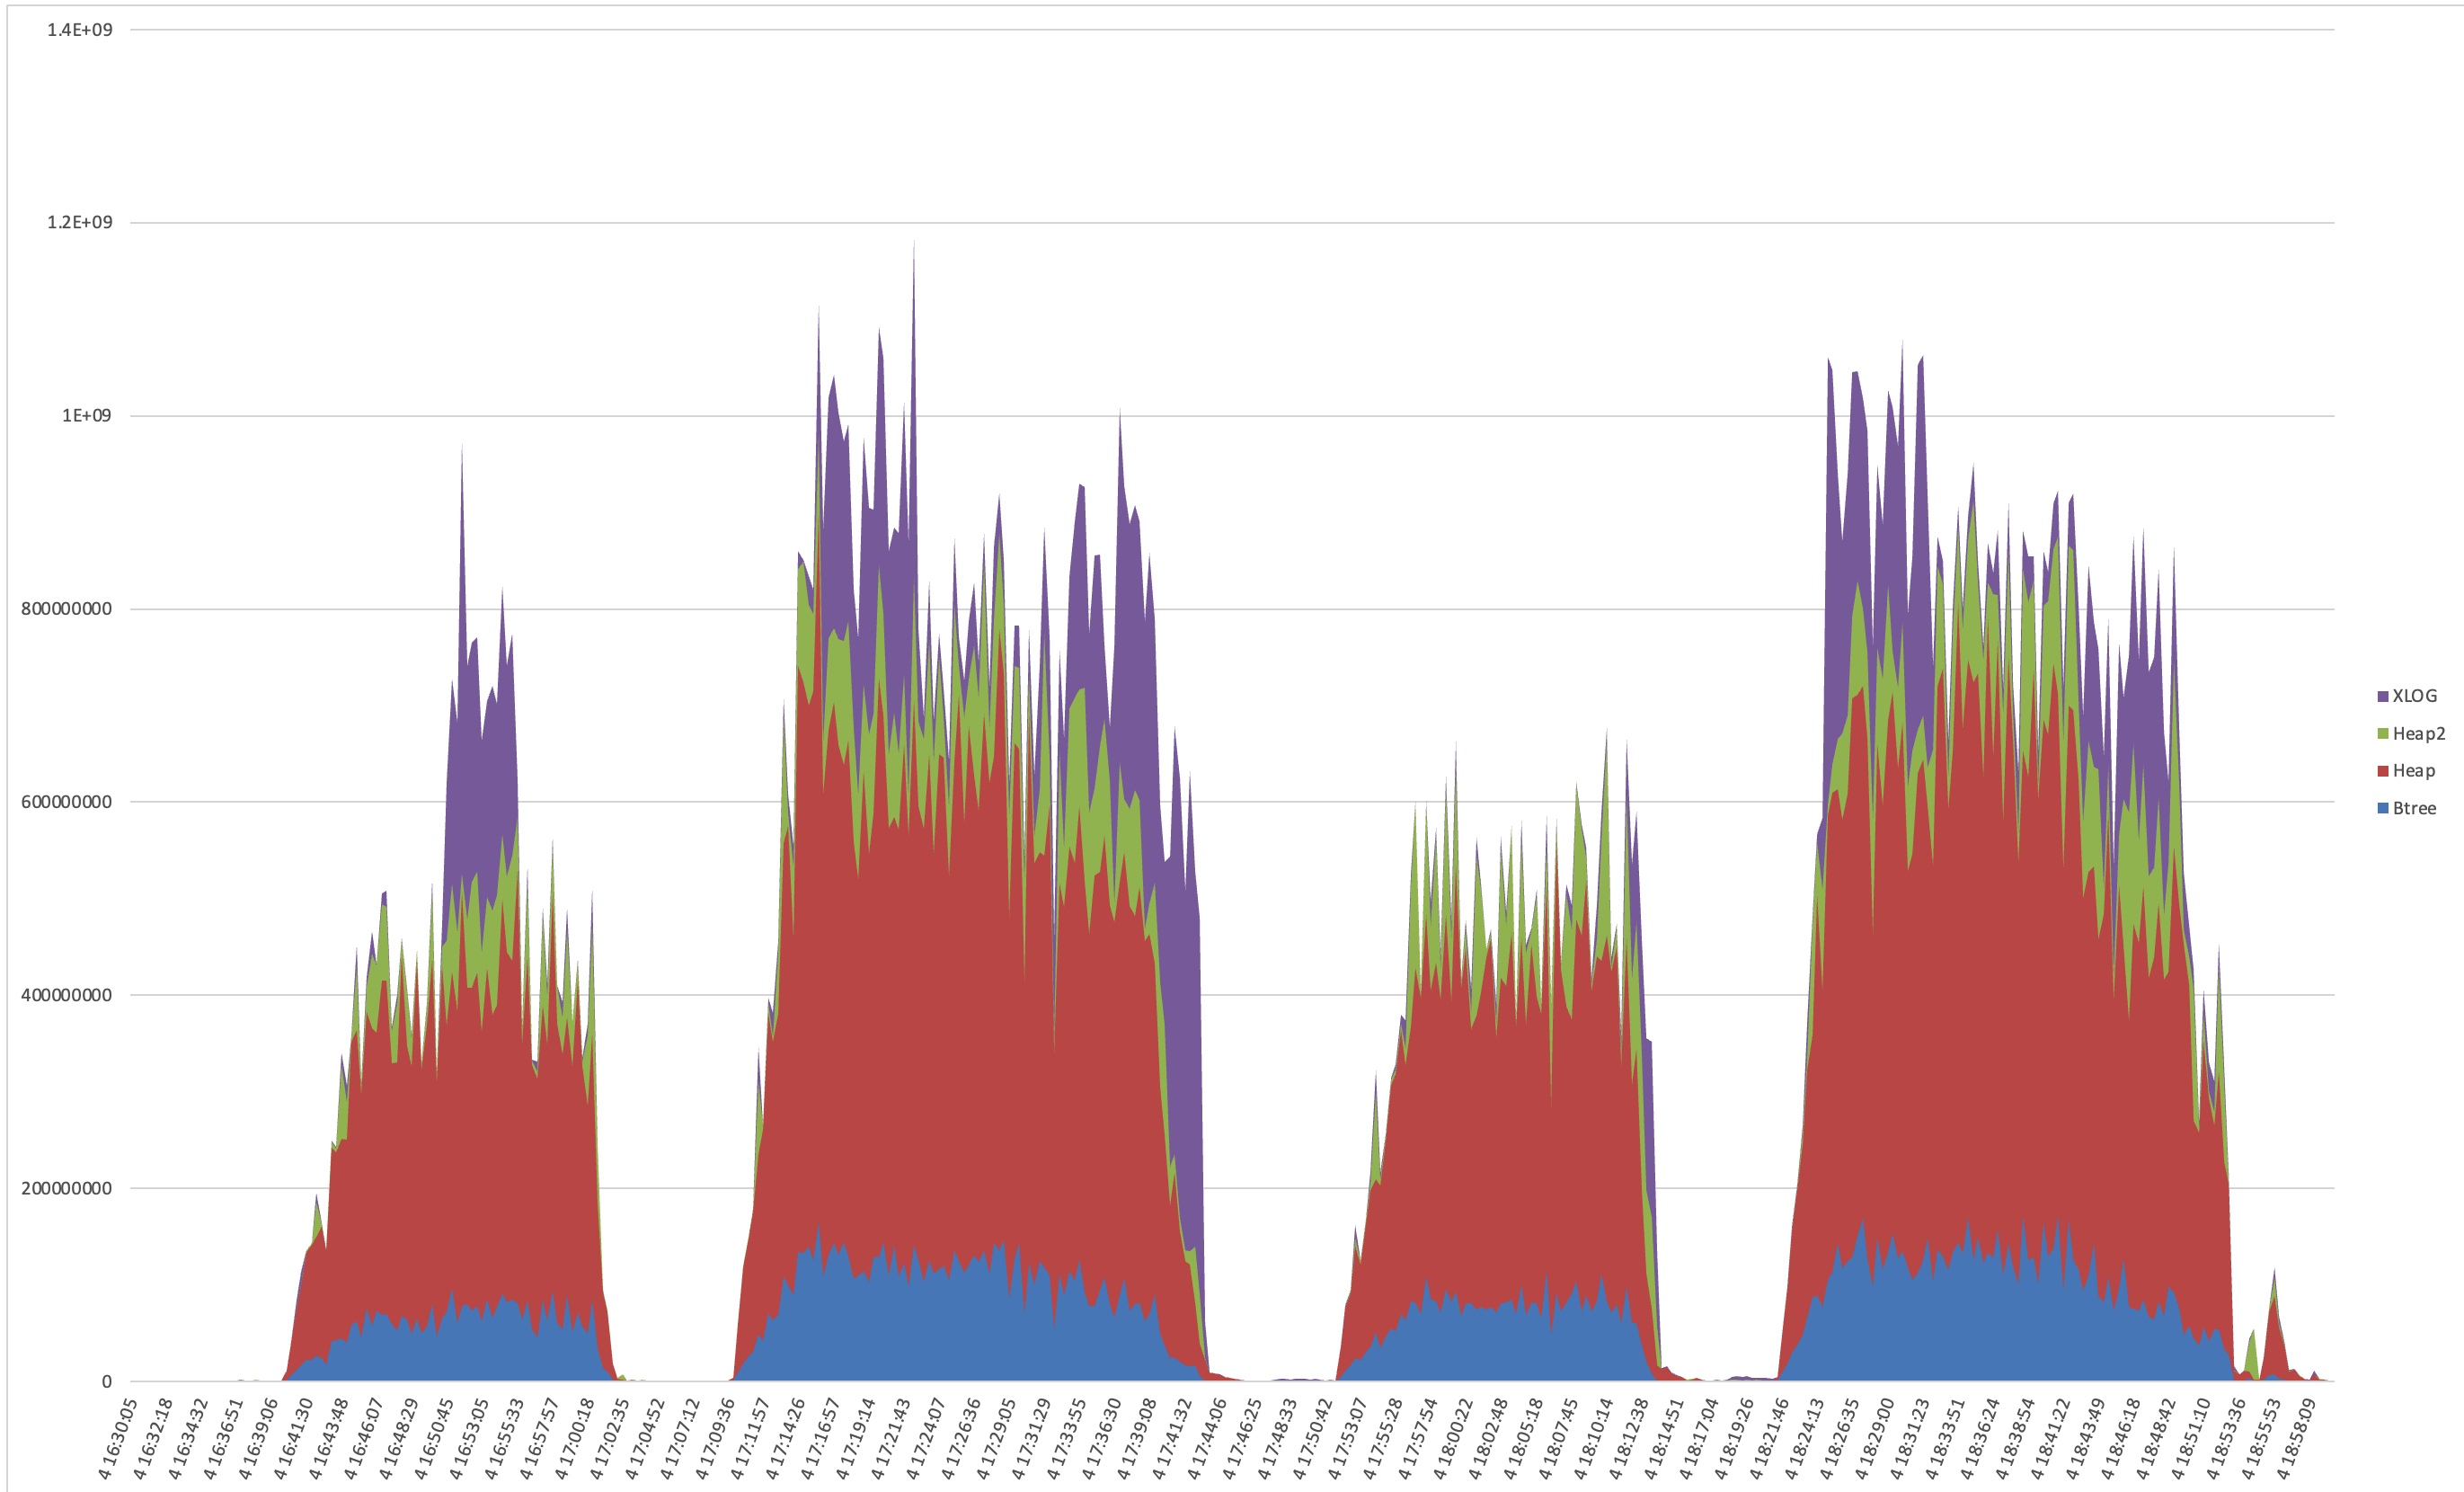
Notice how there are periodic spikes of hundreds of connections waiting on IPC:SyncRep for this system during the test runs: (nb. the plain colon represents CPU time)
That led me to check network traffic, which showed corresponding bursts of traffic between the primary and replicas. Something was periodically creating giant spikes of WAL.
So, I went hunting in the WAL itself. Using pg_walinspect on Postgres 16, I broke down records by resource manager and found massive surges from XLOG; specifically from full-page image (FPI) writes. These weren’t steady; they came in waves and caused serious commit latency waiting for downstream replication.
Here’s a graph of the record_size and fpi_size bytes per resource type during two benchmark runs:
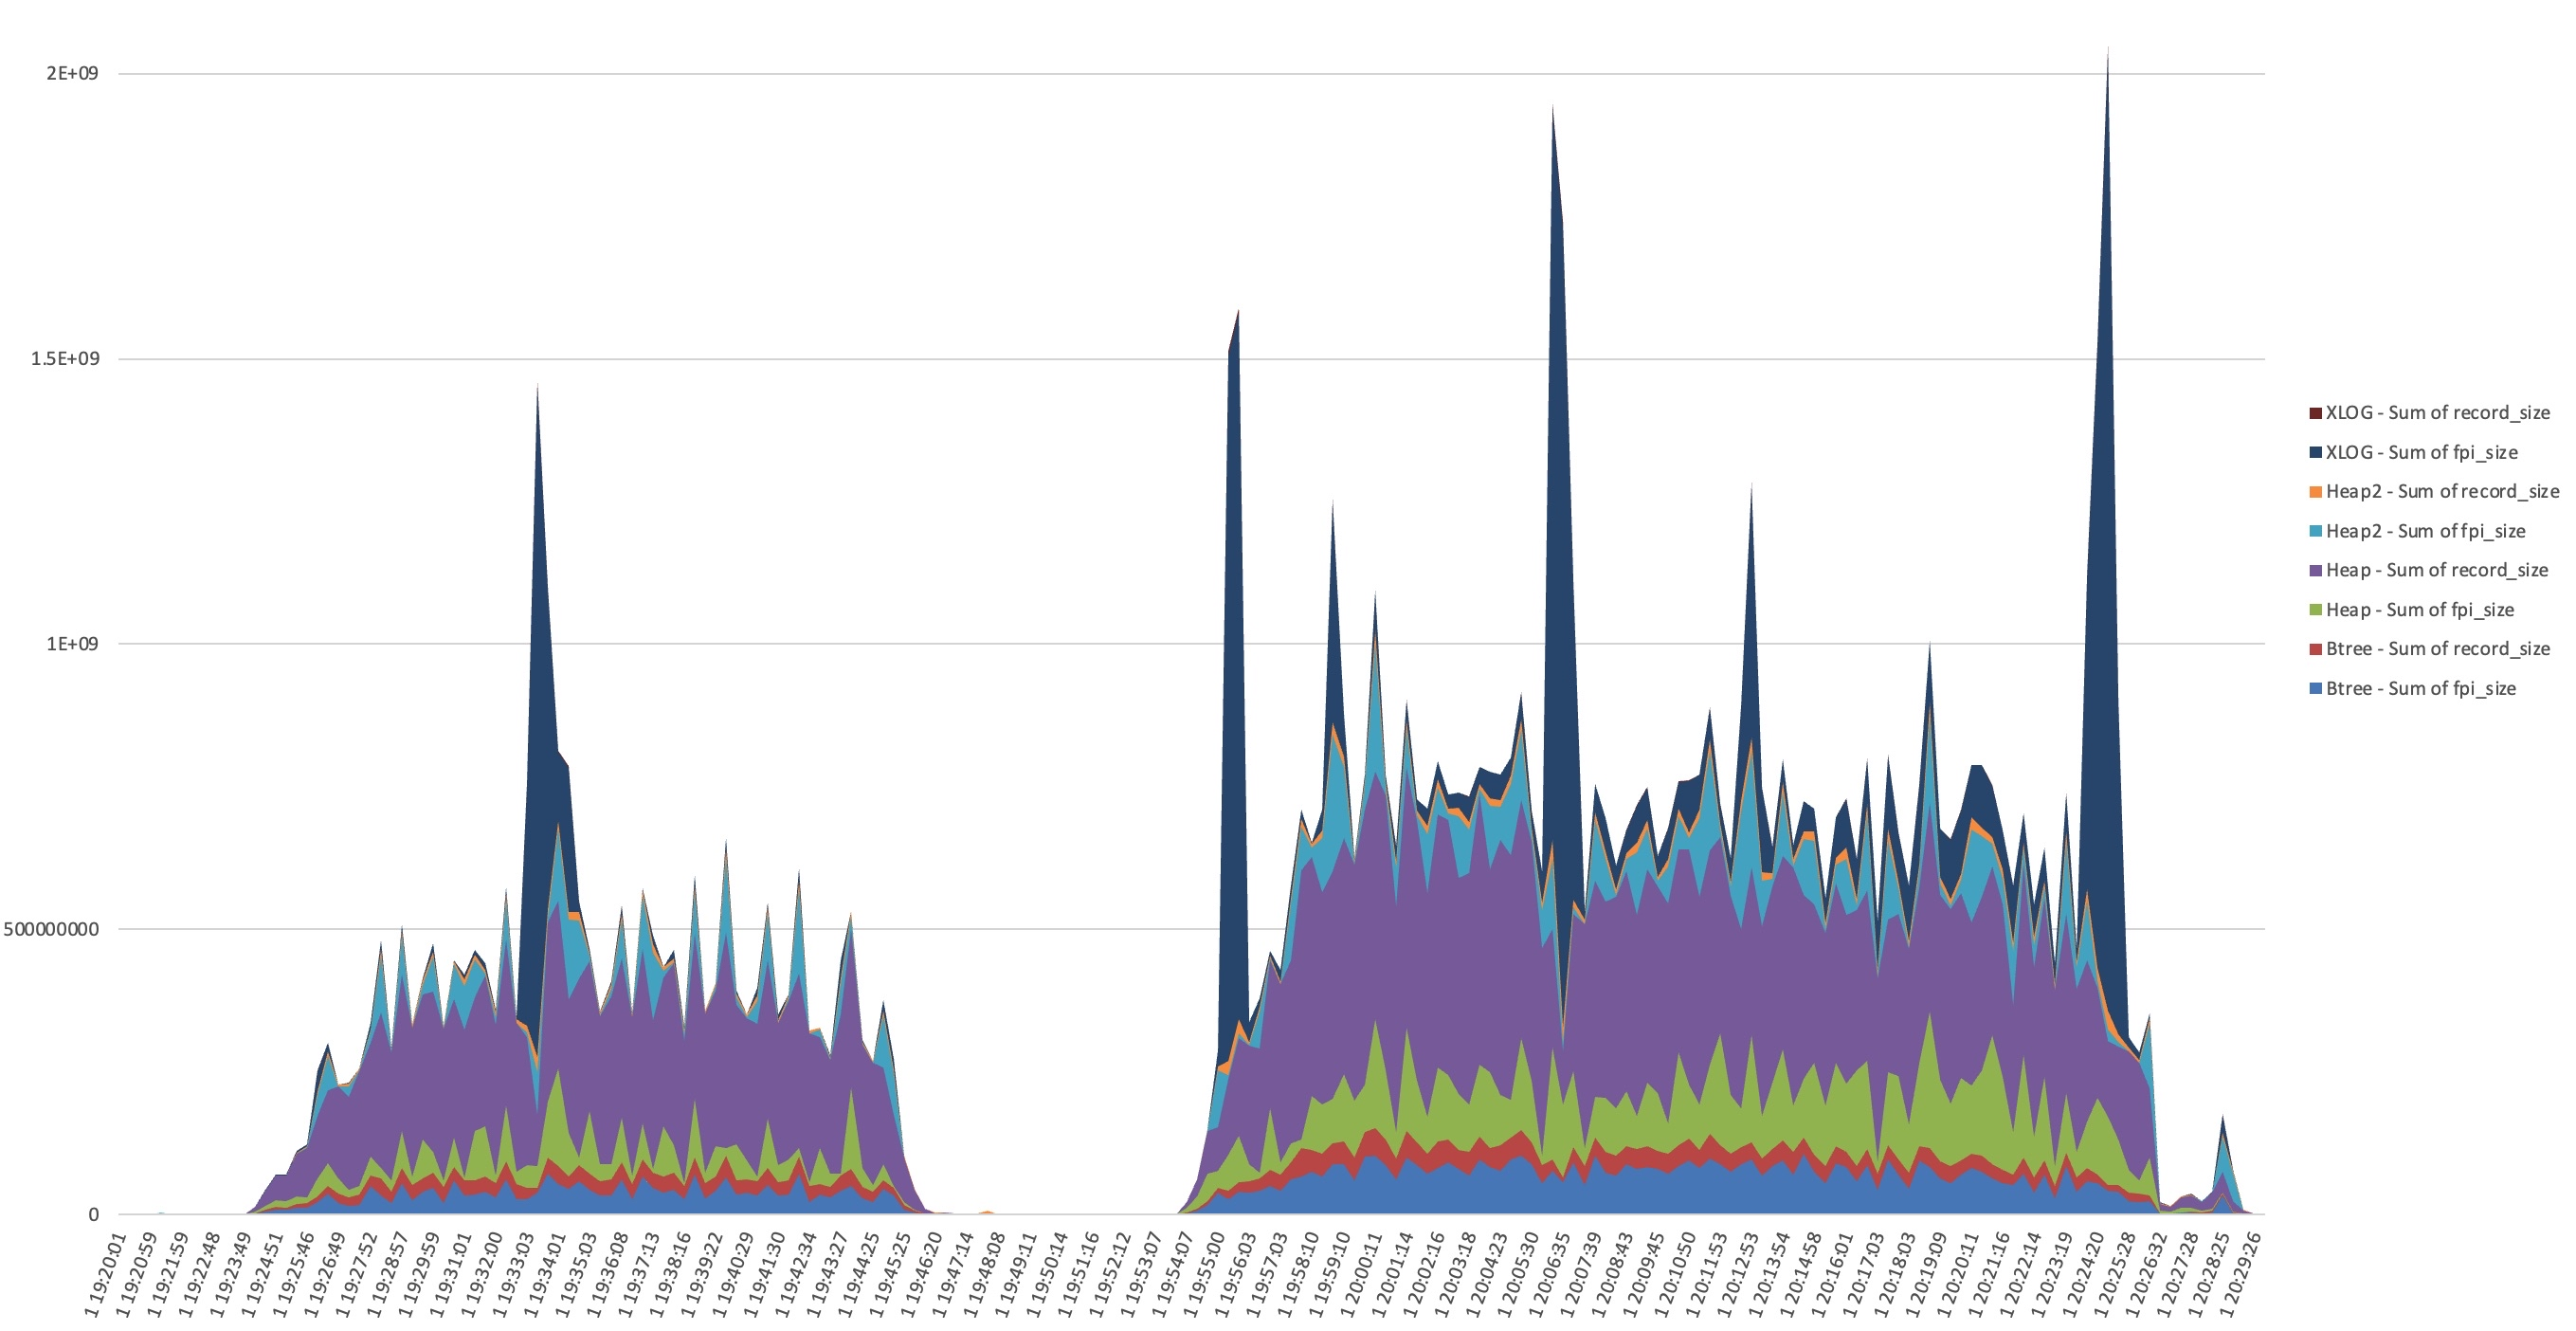
I dumped the WAL and in the first sample I see it’s dominated by FPI_FOR_HINT blocks in sequential order from a specific 40GB toast table. I only see INSERT in pg_stat_statements for this table.
This confused me. Looking through Postgres source code, two possible sources I saw were log_newpage*() and MarkBufferDirtyHint() and I thought: where are these hint updates coming from? A Postgres SELECT can dirty pages by setting tuple hint bits when it reads rows whose inserting or deleting transaction has committed but whose visibility status has not yet been cached in the tuple header, which commonly happens after recent inserts, updates, deletes, or other write activity. Some napkin math suggested that 20,000 tuple ins/upd/del per second can dirty 10GB in one minute with hints. (We were close to 20k tuples/s in the run on the left side; second workload is over 30k/s.) Maybe spikes in dirty buffers were triggering forced checkpoints?
But after taking a look, the problem here wasn’t checkpoints themselves. A lot more checkpoints were happening than WAL spikes and there was no correlation between the timings. (You should still read Shaun’s blog though!)
But this is where the trail leads me to start thinking about autovacuum. From autovacuum logs (always enable these) I could see that the timing of autovacuum runs aligned perfectly with each WAL storm.
And then I had another realization: autovacuum_vacuum_cost_delay was set to 0 on this system. Crazy theory number two: vacuum is setting hint bits on an append only table very fast, and maybe the longer the gap between checkpoint and vacuum, the worse the damage? Remember that the first time a page is modified after checkpoint, the full page is written into the WAL log to protect from torn writes during system failures (because the OS block size usually doesn’t align with the database block size). Even if the update is just setting a hint bit – the WAL record can include the full 8k database block.
Without any cost throttling, autovacuum was racing through large tables at full speed, dirtying pages with hint bit updates – writing the full pages to the WAL log faster than the system could replicate them. That triggered bursts of WAL traffic, replication lag, and the intermittent major performance hiccups that had started this whole chase.
We reverted autovacuum_vacuum_cost_delay to its default 2ms, reran the workload, and everything smoothed out beautifully. You can still see the XLOG records generated by autovacuum, but they were more spread out. The WAL volume didn’t swing as wildly, replication didn’t crash as dramatically, and application latency spikes no longer overwhelmed backlogs and work queues. There was still variance in the performance – but we could tune the application to handle it, and we got much higher overall throughput without tipping everything over.
In hindsight, I remember seeing that setting early on and thinking,
“it’s a big server & workload, cost delay 0 won’t do anything that bad, won’t completely burn down the server, so I can probably let that one stay where it is”
I was completely wrong.
Moral of the story:
Vacuum tuning may feel like a dark art, but the defaults exist for good reason. Even one millisecond of cost delay keeps autovacuum from overwhelming the system and flooding WAL. Checkpoints and pg_repack and materialized view refreshes aren’t the only things that cause write storms; autovacuum can cause them too.
In other words: resist the temptation to go full throttle – your replicas and your applications and your future-self will thank you.
Database Schema Migrations in 2026 – Survey
What is the best way to manage database schema migrations in 2026?
Since this sort of thing is getting easier with AI tooling, I spent some time doing a survey across a bunch of recognizable multi-contributor open source projects to see how they do database schema change management.
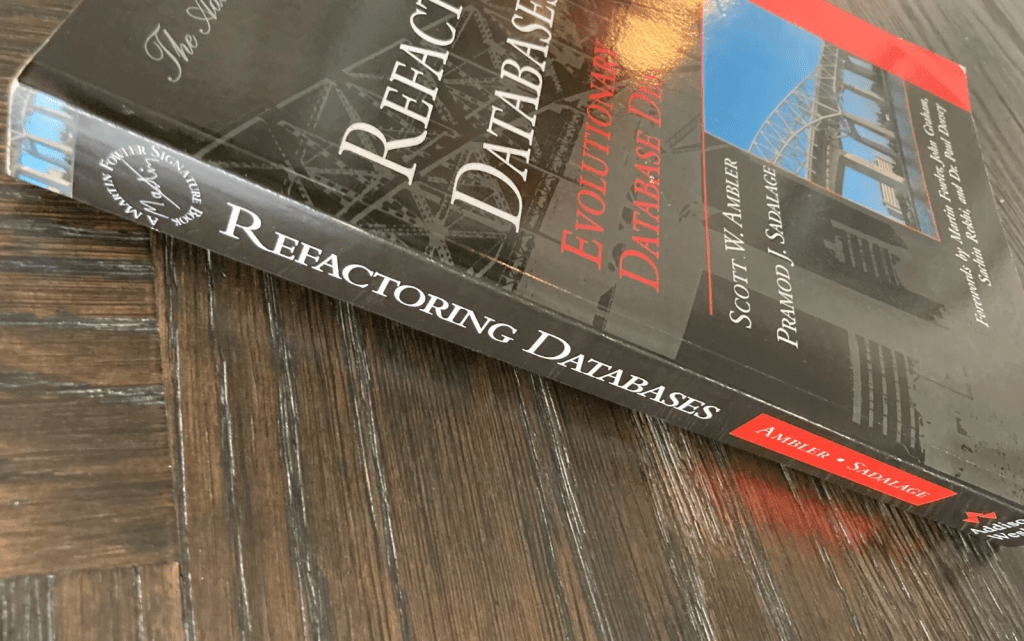
Biggest takeaway: the framework provided by your programming language is the most common pattern. After that seems to be custom project-specific code. Even while Pramod Sadalage and Martin Fowler’s twenty-year-old general evolutionary pattern is followed, I was surprised to see very few occurrences of the specific tools they listed in their 2016 article about Evolutionary Database Design. Those tools might be used behind some corporate firewalls, but they aren’t showing up in collaborative open source projects.
Second takeaway: it should be obvious that we still have schema migrations with document databases and distributed NoSQL databases; but lots of interesting illustrations here of what it looks like in practice to deal with document models and NoSQL schemas as they change over time. My recent comment on an Adam Jacob LinkedIn post:“life is great as long as changing your schema can remain avoidable (ie. requiring some kind of migration).”
What about the method of triggering the schema migrations? The most common pattern is that the application process itself triggers schema migration. After that we have kubernetes jobs.
The rest of this blog post is the supporting data I generated with some AI tooling. I made sure to include links to source code, for verifying accuracy. I spot checked a few and they were all accurate – but I didn’t go through every single project.
If you spot errors, please let me know!! I’ll update the blog.
Update Mar 26: On LinkedIn, Elizabeth Christensen mentioned last year’s virtual meetup about this topic [recording available on YouTube]. And I hadn’t originally mentioned it in this post, but probably worth pointing out that I think the three broad categories of schema change management tools are: (1) app frameworks [which this blog is focused on], (2) DB-agnostic [liquibase, flyway, sqitch, atlasgo, etc] and (3) DB-specific [pgroll, oracle edition based redefinition, etc] – it’s a very interesting landscape!
A survey of how major open-source projects handle database schema migrations. Each project includes a real code example and how migrations are triggered during upgrades.
Kubernetes Migration Trigger MethodsProjects with no official Helm chart or k8s support (Mastodon, Discourse, Sentry, Zulip, NetBox, Metabase, Lemmy, MediaWiki, Matrix Synapse†, CHT Core, Signal Server, Firefox, Chromium, Signal Desktop, FDB Record Layer, RxDB) are omitted.
Trigger MethodProjectsDedicated k8s Job (Helm hook)GitLab (post-deploy), Airflow (post-install/upgrade), Superset (post-install/upgrade), Temporal (pre-deploy), Kong (pre-install), Jaeger (pre-deploy), ThingsBoard (install only; upgrades require a separate manual pod)Init container in pod specGitea (official chart runsgitea migrate in init container before main container starts)App process migrates on pod startupGhost, Backstage, Keycloak, Grafana, Mattermost, Odoo, Parse Server, Appsmith, Rocket.Chat, GraylogTriggered by action against running processWordPress (first admin HTTP request), Kubernetes (StorageVersionMigration CRD triggers in-cluster controller), Dgraph (POST /admin API call; async index rebuild)Manual operator actionCalico (calico-upgrade CLI), Neo4j-Migrations (neo4j-migrations migrate CLI), Nextcloud (occ upgrade via exec or Job), Zipkin (SQL DDL applied before deploy), APISIX (no tooling; manual etcd data transformation)No migration neededCortex (schema versioned in YAML config; new period appended and deployed, old data untouched)
† Matrix Synapse has no official Helm chart from Element; the widely-used community chart (ananace/matrix-synapse) relies on in-process startup migration.
Part 1: Relational 1A. External Migration Frameworks ProjectsLanguageMigration FrameworkTriggerGitLab, Mastodon, DiscourseRubyRails ActiveRecordGitLab: dedicated k8s Job (Helm). Mastodon: manual two-phase CLI; no official Helm chart. Discourse: launcher script runsrake db:migrate during rebuild; no official Helm chart.Sentry, Zulip, NetBoxPythonDjango MigrationsSentry: sentry upgrade CLI (acquires distributed lock; post-deployment migrations must be run separately); official self-hosted is docker-compose only, no official Helm chart. Zulip: scripts/upgrade-zulip script; no official Helm chart, typically deployed on VMs. NetBox: container entrypoint script runs manage.py migrate on container start (netbox-docker); no official Helm chart.Airflow, SupersetPythonAlembicBoth: dedicated k8s Job as Helm post-install/post-upgrade hook.Ghost, BackstageJavaScript, TypeScriptKnex.jsBoth: app code calls migration runner on startup. Both have official Helm charts (Bitnami for Ghost, backstage/charts for Backstage); migrations run in-process at pod startup, no separate job.Keycloak, MetabaseJava, ClojureLiquibaseBoth: app code calls Liquibase on startup. Keycloak: DefaultJpaConnectionProviderFactory; official Helm chart (Bitnami) and k8s Operator exist, auto-migrates at pod startup. Metabase: setup-db! (custom Clojure macros wrap Liquibase changesets); no official Helm chart.LemmyRustDieselApp code calls run_pending_migrations() on startup (before pool is returned). No official Helm chart; typically deployed via docker-compose.GiteaGoXORMOfficial Helm chart exists; init container explicitly runs gitea migrate before the main container starts (not relying on auto-migration). AUTO_MIGRATION=false can disable the in-process fallback.NextcloudPHPDoctrine DBALocc upgrade CLI or web-based updater; not automatic. Official Helm chart exists (nextcloud/helm); init containers only wait for DB readiness. occ upgrade must be run manually (e.g., exec into pod).
1B. Custom Migration Systems
ProjectsLanguageMigration ApproachTriggerGrafana, MattermostGoCustom GoBoth: app code calls migration runner on startup. Both have official Helm charts (grafana-community/helm-charts, mattermost/mattermost-helm); migrations run in-process at pod startup, no separate job. Mattermost also has an offline mattermost db migrate CLI with --dry-run.WordPress, MediaWikiPHPCustom PHPWordPress: app code runs on first admin page HTTP request after update; Bitnami Helm chart exists, auto-migration works in k8s. MediaWiki: manual php maintenance/update.php; no official Helm chart (Wikimedia uses an internal helmfile).Odoo, Parse ServerPython, JavaScriptDeclarative + scriptsOdoo: odoo -u <module> CLI; Bitnami Helm chart exists, migration triggered at pod startup via env var. Parse Server: app code runs schema reconciliation on startup; Bitnami chart available, auto-migrates at pod startup.Matrix SynapsePythonCustom PythonApp code applies delta scripts on startup (main process only; worker processes refuse to start if schema is behind). No official Helm chart from Element; the widely-used community chart (ananace/matrix-synapse) also relies on in-process startup migration.Temporal, KongGo, LuaCustom multi-DBBoth: dedicated CLI tool (temporal-sql-tool update-schema, kong migrations up) + dedicated k8s Job in Helm chart.Zipkin, ThingsBoardJavaCustom multi-DBZipkin: manual SQL file application before starting the server; Bitnami Helm chart exists but provides no migration automation. ThingsBoard: official Helm chart with a dedicated initializedb k8s Job for fresh installs; upgrades require running a separate pod with UPGRADE_TB=true.Firefox, Chromium, Signal DesktopC++, C++, TypeScriptDesktop SQLiteApp code runs sequential version chain on startup. Desktop applications; Kubernetes not applicable.
Part 2: Non-Relational Only
2A. External Migration Frameworks
ProjectsLanguageMigration FrameworkTriggerAppsmith (server-side)JavaMongock (MongoDB)App code runs migrations on startup via Spring Boot auto-configuration (MongockInitializingBeanRunner). Official Helm chart exists; init containers only wait for dependencies (MongoDB, Redis) to be ready — migrations run in the main application process.FDB Record LayerJava(framework itself, powers iCloud)Programmatic — FDBRecordStore.open() checks stored metadata version on each store open. A library, not a deployable service; Kubernetes not applicable.Neo4j-MigrationsJava(tool itself)neo4j-migrations migrate CLI, or app code on startup via Spring Boot InitializingBean. Neo4j has an official Helm chart (neo4j/helm-charts); this tool is not bundled in it and must be run separately (e.g., as a k8s Job).
2B. Custom Migration Systems
ProjectsLanguageMigration ApproachTriggerKubernetes, Calico, Vitess, APISIXGo, Go, Go, Luaetcd / protobufK8s: StorageVersionMigration CRD triggers an in-cluster controller. Calico: operator-run calico-upgrade CLI tool. Vitess: topology schema evolves via additive protobuf field changes — no migration tooling needed. APISIX: fully manual, no tooling provided.JaegerGoCassandra CQLDedicated k8s Job using jaeger-cassandra-schema Docker image, run before deploying Jaeger.Rocket.Chat, Appsmith (DSL), GraylogTypeScript, TypeScript, JavaMongoDBRocket.Chat/Graylog: app code runs migrations on startup; both have official Helm charts (RocketChat/helm-charts, Graylog2/graylog-helm), migrations run in-process at pod startup. Appsmith DSL: browser-side on every page load (migrations never written back to server); Kubernetes not applicable.RxDB, CHT CoreTypeScript, JavaScriptCouchDB / offline-firstRxDB: client-side library; runs migrations per-device when a collection is opened; Kubernetes not applicable. CHT: app-level migrations run as part of API server startup; cluster-level migration requires a separate manual Docker tool; no official k8s support, deployed via docker-compose.Cortex, Signal ServerGo, JavaDynamoDBCortex: time-partitioned schema config — no data rewrite, old tables coexist; official Helm chart exists (cortex-helm-chart), schema changes are config-file updates with no migration job. Signal Server: no explicit migration; new fields written into JSON blob on next update; tables provisioned via IaC; not publicly self-hosted, no Helm chart.DgraphGoGraph DBPOST /admin endpoint or dgraph live --schema; async background goroutine reindexes affected predicates. Official Helm chart exists (dgraph-io/charts); schema updates are pushed to running pods via Admin API.
1A. Relational Database Support: Using External Migration Frameworks
Rails ActiveRecord Migrations
GitLab
Background migrations, batched migrations, migration helpers, extensive written policies for safe migrations at scale. Uses a custom Gitlab::Database::Migration base class rather than stock ActiveRecord.
Trigger: Dedicated Kubernetes Job in the official Helm chart (charts/gitlab/charts/migrations/). The job runs /scripts/db-migrate and must complete before web/Sidekiq pods roll out. Migrations never run automatically on app startup. (Helm chart)
Example — creating a partitioned table with sparse indexes (source):
class CreateWorkItemTransitions < Gitlab::Database::Migration[2.3]
  milestone '18.3'

  def up
    create_table :work_item_transitions, id: false do |t|
      t.bigint :work_item_id, primary_key: true, default: nil
      t.bigint :namespace_id, null: false
      t.bigint :moved_to_id, null: true
      t.index :moved_to_id, where: 'moved_to_id IS NOT NULL',
        name: 'index_work_item_transitions_on_moved_to_id'
    end
  end
end
Federated: thousands of independently-upgraded instances, so migrations must be safe across version skew.
Trigger: NOT automatic. Admins run migrations manually in two phases — SKIP_POST_DEPLOYMENT_MIGRATIONS=true rails db:migrate (before restart) then rails db:migrate (after). No official Helm chart.
Example — data migration translating theme settings to new key/value pairs (source):
class MigrateUserTheme < ActiveRecord::Migration[8.0]
  disable_ddl_transaction!
  class User < ApplicationRecord; end

  def up
    User.where.not(settings: nil).find_each do |user|
      settings = JSON.parse(user.attributes_before_type_cast['settings'])
      case settings['theme']
      when 'default'
        settings['web.color_scheme'] = 'dark'
      when 'mastodon-light'
        settings['web.color_scheme'] = 'light'
      end
      user.update_column('settings', JSON.generate(settings))
    end
  end
end
Mature self-hosted forum with a disciplined migration history over 10+ years.
Trigger: discourse_docker launcher runs bundle exec rake db:migrate during ./launcher rebuild app. Auto-migration on every boot is off by default, controlled by MIGRATE_ON_BOOT env var.
Example — DDL + data backfill in one migration (source):
class CreateCategoryApprovalGroups < ActiveRecord::Migration[8.0]
  def up
    create_table :category_posting_review_groups do |t|
      t.integer :post_type, null: false
      t.integer :category_id, null: false
      t.integer :group_id, null: false
      t.timestamps null: false
    end
    # Backfill from existing category_settings
    execute(<<~SQL)
      INSERT INTO category_posting_review_groups (post_type, permission, category_id, group_id, created_at, updated_at)
      SELECT 0, 1, cs.category_id, 0, NOW(), NOW()
      FROM category_settings cs WHERE cs.require_topic_approval = true
    SQL
  end
end
Operates at massive scale; has written extensively about the pain of running Django migrations on huge tables.
Trigger: sentry upgrade CLI (called via docker compose run --rm web upgrade in self-hosted). Acquires a distributed lock. Migrations marked is_post_deployment = True are skipped and must be run manually in a separate step.
Example — post-deployment data backfill with Redis progress checkpointing (source):
class Migration(CheckedMigration):
    is_post_deployment = True  # won't auto-run during deploy

    operations = [
        migrations.RunPython(
            backfill_group_open_periods,
            migrations.RunPython.noop,
            hints={"tables": ["sentry_groupopenperiod"]},
        ),
    ]
Well-engineered chat server, known for thoughtful code quality and contributor documentation.
Trigger: scripts/upgrade-zulip → upgrade-zulip-stage-3 stops the server, runs manage.py migrate --noinput, then restarts. Not automatic on startup.
Example — data-repair migration using raw SQL lateral join across JSONB audit log (source):
class Migration(migrations.Migration):
    atomic = False  # outside a transaction for large repair work

    operations = [
        migrations.RunPython(
            recreate_missing_realmemoji,
            elidable=True,
        ),
    ]
Network infrastructure management tool widely used by network teams. Large plugin ecosystem extends the schema.
Trigger: Auto on container startup. netbox-docker entrypoint checks manage.py migrate --check and runs manage.py migrate --no-input if unapplied migrations exist.
Example — AddField + RunPython backfill + RemoveField in one migration (source):
operations = [
    migrations.AddField(
        model_name='vminterface', name='primary_mac_address',
        field=models.OneToOneField(null=True, on_delete=SET_NULL, to='dcim.macaddress'),
    ),
    migrations.RunPython(code=populate_mac_addresses, reverse_code=migrations.RunPython.noop),
    migrations.RemoveField(model_name='vminterface', name='mac_address'),
]
Apache project, widely deployed in very different operator environments.
Trigger: Dedicated Kubernetes Job (migrate-database-job.yaml) as a Helm post-install/post-upgrade hook running airflow db migrate. All other pods have a wait-for-airflow-migrations init container that blocks until the job completes. (Helm chart)
Example (source):
revision = "53ff648b8a26"
down_revision = "a5a3e5eb9b8d"

def upgrade():
    op.create_table(
        "revoked_token",
        sa.Column("jti", sa.String(32), primary_key=True, nullable=False),
        sa.Column("exp", UtcDateTime, nullable=False, index=True),
    )

def downgrade():
    op.drop_table("revoked_token")
Apache data visualization platform, large contributor base.
Trigger: Dedicated Kubernetes Job (init-job.yaml) as a Helm post-install/post-upgrade hook running superset db upgrade. (Helm chart)
Example (source):
def upgrade():
    op.add_column("dbs", sa.Column("password", sa.LargeBinary(), nullable=True))

def downgrade():
    op.drop_column("dbs", "password")
Popular blogging platform. Uses knex-migrator (a wrapper around Knex).
Trigger: Auto on every startup. boot.js → DatabaseStateManager checks knexMigrator.isDatabaseOK() and calls knexMigrator.migrate() if needed. (source)
Example (source):
const {addTable} = require('../../utils');

module.exports = addTable('members_created_events', {
    id:               {type: 'string', maxlength: 24, nullable: false, primary: true},
    created_at:       {type: 'dateTime', nullable: false},
    member_id:        {type: 'string', maxlength: 24, nullable: false,
                       references: 'members.id', cascadeDelete: true},
    attribution_id:   {type: 'string', maxlength: 24, nullable: true},
    source:           {type: 'string', maxlength: 50, nullable: false}
});
Spotify-created developer portal. Plugin architecture means migrations come from many independent teams.
Trigger: Auto on startup. Each plugin’s CatalogBuilder.build() calls applyDatabaseMigrations(dbClient) → knex.migrate.latest() before any database objects are constructed. (source)
Example (source):
exports.up = async function up(knex) {
  await knex.schema.createTable('entities_relations', table => {
    table.comment('All relations between entities in the catalog');
    table.uuid('originating_entity_id')
      .references('id').inTable('entities').onDelete('CASCADE').notNullable();
    table.string('type').notNullable();
    table.string('target_full_name').notNullable();
    table.primary(['source_full_name', 'type', 'target_full_name']);
  });
};
Red Hat-backed identity server. Liquibase changelogs declared in XML.
Trigger: Auto on startup. DefaultJpaConnectionProviderFactory calls LiquibaseJpaUpdaterProvider.update() → liquibase.update(). No special Helm/Operator handling — pods auto-migrate. (source)
Example (source):
<changeSet author="keycloak" id="25.0.0-28265-tables">
    <addColumn tableName="OFFLINE_USER_SESSION">
        <column name="BROKER_SESSION_ID" type="VARCHAR(1024)" />
        <column name="VERSION" type="INT" defaultValueNumeric="0" />
    </addColumn>
    <addColumn tableName="OFFLINE_CLIENT_SESSION">
        <column name="VERSION" type="INT" defaultValueNumeric="0" />
    </addColumn>
</changeSet>
BI tool written in Clojure. Uses Liquibase under the hood with custom Clojure macros (define-migration, define-reversible-migration) layered on top.
Trigger: Auto on startup. setup-db! → run-schema-migrations! → Liquibase’s migrate-up-if-needed!. (source)
Example — custom Clojure migration macro wrapping Liquibase (source):
(define-migration DeleteAbandonmentEmailTask
  (custom-migrations.util/with-temp-schedule! [scheduler]
    (qs/delete-trigger scheduler
      (triggers/key "metabase.task.abandonment-emails.trigger"))
    (qs/delete-job scheduler
      (jobs/key "metabase.task.abandonment-emails.job"))))
Federated Reddit alternative. Diesel generates migration SQL files.
Trigger: Auto on every startup. build_db_pool() calls run_pending_migrations() synchronously before the pool is returned. A standalone lemmy_diesel_utils binary also allows running migrations offline. (source)
Example (source):
CREATE TABLE private_message (
    id serial PRIMARY KEY,
    creator_id int REFERENCES user_ ON UPDATE CASCADE ON DELETE CASCADE NOT NULL,
    recipient_id int REFERENCES user_ ON UPDATE CASCADE ON DELETE CASCADE NOT NULL,
    content text NOT NULL,
    deleted boolean DEFAULT FALSE NOT NULL,
    read boolean DEFAULT FALSE NOT NULL,
    published timestamp NOT NULL DEFAULT now(),
    updated timestamp
);
Git hosting platform. Migrations are Go functions using XORM for cross-database compatibility.
Trigger: Auto on startup (unless AUTO_MIGRATION=false in app.ini). InitDBEngine() → Migrate() compares the Version table against ExpectedDBVersion(). (source)
Example — typical pattern: define minimal struct, call SyncWithOptions (source):
func AddExclusiveOrderColumnToLabelTable(x *xorm.Engine) error {
    type Label struct {
        ExclusiveOrder int `xorm:"DEFAULT 0"`
    }
    _, err := x.SyncWithOptions(xorm.SyncOptions{
        IgnoreConstrains: true,
        IgnoreIndices:    true,
    }, new(Label))
    return err
}
Huge self-hosted user base. Plugin ecosystem means third-party apps also run their own migrations.
Trigger: occ upgrade CLI command or web-based updater. Updater::doUpgrade() instantiates MigrationService and calls migrate(). Not automatic on every page load. (source)
Example — using Doctrine’s schema abstraction to change a column type (source):
class Version34000Date20260318095645 extends SimpleMigrationStep {
    public function changeSchema(IOutput $output, Closure $schemaClosure, array $options): ?ISchemaWrapper {
        $schema = $schemaClosure();
        if ($schema->hasTable('jobs')) {
            $table = $schema->getTable('jobs');
            $argumentColumn = $table->getColumn('argument');
            if ($argumentColumn->getType() !== Type::getType(Types::TEXT)) {
                $argumentColumn->setType(Type::getType(Types::TEXT));
                return $schema;
            }
        }
        return null; // idempotency guard — no change needed
    }
}
Must keep migrations working across 3 DB backends (SQLite, PostgreSQL, MySQL). Uses a Go DSL with per-dialect SQL dispatch.
Trigger: Auto on every startup. ProvideService() calls s.Migrate() synchronously — the server won’t start if migration fails. Official Helm chart has no migration job; relies entirely on auto-migration. (source)
Example — per-dialect SQL in one migration (source):
mg.AddMigration("Update uid column values in alert_notification", new(RawSQLMigration).
    SQLite("UPDATE alert_notification SET uid=printf('%09d',id) WHERE uid IS NULL;").
    Postgres("UPDATE alert_notification SET uid=lpad('' || id::text,9,'0') WHERE uid IS NULL;").
    Mysql("UPDATE alert_notification SET uid=lpad(id,9,'0') WHERE uid IS NULL;"))
Enterprise messaging. Switched from a custom Go DSL to morph (their own migration engine) with embedded .up.sql/.down.sql files.
Trigger: Auto on startup by default. sqlstore.New() calls store.migrate(). Also has an offline mattermost db migrate CLI with --dry-run and --save-plan flags for zero-downtime deploys. Helm chart has no migration job. (source)
Example (source):
UPDATE AccessControlPolicies AS p
SET Name = LEFT(p.Name, 128 - LENGTH(' (' || p.ID || ')')) || ' (' || p.ID || ')'
FROM (
    SELECT ID, Name, ROW_NUMBER() OVER (PARTITION BY Name ORDER BY CreateAt ASC) AS rn
    FROM AccessControlPolicies WHERE Type = 'parent'
) AS dupes
WHERE p.ID = dupes.ID AND dupes.rn > 1;

CREATE UNIQUE INDEX IF NOT EXISTS idx_accesscontrolpolicies_name_type
    ON AccessControlPolicies (Name, Type) WHERE Type = 'parent';
Famously has no migration framework. Uses dbDelta() for schema and version-numbered upgrade functions for data. 40%+ of the web runs on this.
Trigger: Auto on first admin page load after update. wp-admin/admin.php checks get_option('db_version') vs $wp_db_version; if they differ, redirects to upgrade.php which calls each version-specific upgrade_NNN() function.
Example — version-specific data migration (source):
function upgrade_700() {
    global $wp_current_db_version, $wpdb;
    if ( $wp_current_db_version < 61644 ) {
        $wpdb->update(
            $wpdb->usermeta,
            array( 'meta_value' => 'modern' ),
            array( 'meta_key' => 'admin_color', 'meta_value' => 'fresh' )
        );
    }
}
Powers Wikipedia. Has its own maintenance script system with separate SQL files per database engine.
Trigger: php maintenance/update.php must be run manually after deploying new code. Wikimedia runs this as a k8s Job in their deployment pipeline via the scap tool. Never auto-runs on web requests.
Example — batch data migration merging a temp table into the main table (source):
protected function doDBUpdates() {
    $dbw = $this->getDB( DB_PRIMARY );
    if ( !$dbw->tableExists( 'revision_comment_temp', __METHOD__ ) ) {
        $this->output( "revision_comment_temp does not exist, nothing to do.\n" );
        return true;
    }
    // batch-copies revcomment_comment_id → rev_comment_id
    $dbw->newUpdateQueryBuilder()
        ->update( 'revision' )
        ->set( [ 'rev_comment_id' => $row->revcomment_comment_id ] )
        ->where( [ 'rev_id' => $row->rev_id ] )
        ->caller( __METHOD__ )->execute();
}
ERP with 10,000+ modules. ORM handles additive changes declaratively; renames, transforms, and restructuring require explicit pre/post/end migration scripts. Major version upgrades use Odoo SA’s proprietary upgrade service or the community OpenUpgrade project (~120 scripts per major version).
Trigger: odoo -u <module> or -u all. MigrationManager in loading.py discovers migrations/<version>/pre-*.py and post-*.py files via glob and exec_module()s each script’s migrate(cr, version) function.
Example — pre-migrate script changing FK constraints (source):
def migrate(cr, version):
    cr.execute("""
        SELECT value::int FROM ir_config_parameter WHERE key = 'analytic.project_plan'
    """)
    [project_plan_id] = cr.fetchone()
    cr.execute("SELECT id FROM account_analytic_plan WHERE id != %s AND parent_id IS NULL",
               [project_plan_id])
    plan_ids = [r[0] for r in cr.fetchall()]
    for column in [f"x_plan{id_}_id" for id_ in plan_ids]:
        sql.drop_constraint(cr, 'account_analytic_line', f'account_analytic_line_{column}_fkey')
        sql.add_foreign_key(cr, 'account_analytic_line', column,
                            'account_analytic_account', 'id', 'restrict')
Backend-as-a-Service (originally Facebook, 21k stars). No numbered migration scripts — declarative schema reconciliation at startup.
Trigger: Auto on startup. ParseServer.start() adds new DefinedSchemas(schema, config).execute() to startupPromises. Server won’t accept traffic until reconciliation completes (or process.exit(1) in production on failure). (source)
Example — schema reconciliation engine (source):
async executeMigrations() {
  await this.createDeleteSession();
  const schemaController = await this.config.database.loadSchema();
  this.allCloudSchemas = await schemaController.getAllClasses();
  await Promise.all(
    this.localSchemas.map(async localSchema => this.saveOrUpdate(localSchema))
  );
  this.checkForMissingSchemas();
  await this.enforceCLPForNonProvidedClass();
}
Federated messaging server. Numbered SQL/Python delta scripts. Federation means different homeservers run different versions simultaneously.
Trigger: Auto on startup (main process only). prepare_database() reads schema_version and applies all pending delta scripts. Worker processes refuse to start if schema is unmigrated — only the main process is permitted to apply changes. (source)
Example (source):
CREATE TABLE sliding_sync_connection_lazy_members (
    connection_key BIGINT NOT NULL
        REFERENCES sliding_sync_connections(connection_key) ON DELETE CASCADE,
    room_id TEXT NOT NULL,
    user_id TEXT NOT NULL,
    last_seen_ts BIGINT NOT NULL
);

CREATE UNIQUE INDEX sliding_sync_connection_lazy_members_idx
    ON sliding_sync_connection_lazy_members (connection_key, room_id, user_id);
Workflow orchestration engine. Versioned SQL scripts per database backend.
Trigger: temporal-sql-tool update-schema CLI. In k8s, runs as a dedicated Kubernetes Job in the official Helm chart (charts/temporal/templates/server-job.yaml). (Helm chart)
Example (source):
CREATE TABLE visibility_tasks(
  shard_id INTEGER NOT NULL,
  task_id BIGINT NOT NULL,
  data BYTEA NOT NULL,
  data_encoding VARCHAR(16) NOT NULL,
  PRIMARY KEY (shard_id, task_id)
);
Popular API gateway (43k stars). Custom Lua migration framework. Deprecated Cassandra in 2.7 and removed it in 3.4. Now PostgreSQL-only.
Trigger: kong migrations bootstrap (fresh install) / kong migrations up + kong migrations finish (upgrades). In k8s, runs as a dedicated Kubernetes Job in the official Helm chart. (Helm chart)
Example (source):
return {
  postgres = {
    up = [[
      DO $$
      BEGIN
        ALTER TABLE IF EXISTS ONLY "plugins" ADD "protocols" TEXT[];
      EXCEPTION WHEN DUPLICATE_COLUMN THEN
        -- Do nothing, accept existing state
      END;
      $$;

      CREATE TABLE IF NOT EXISTS "tags" (
        entity_id    UUID    PRIMARY KEY,
        entity_name  TEXT,
        tags         TEXT[]
      );
    ]],
  },
}
The original distributed tracing system (17k stars, since 2012). Bundles versioned CQL and SQL schema files.
Trigger: Schema must be applied manually before running Zipkin — mysql < mysql.sql. Zipkin does not auto-apply schema on startup; it introspects existing tables but does not create or alter them. (docs)
Example (source):
CREATE TABLE IF NOT EXISTS zipkin_spans (
  `trace_id_high` BIGINT NOT NULL DEFAULT 0,
  `trace_id`      BIGINT NOT NULL,
  `id`            BIGINT NOT NULL,
  `name`          VARCHAR(255) NOT NULL,
  `start_ts`      BIGINT,
  `duration`      BIGINT,
  PRIMARY KEY (`trace_id_high`, `trace_id`, `id`)
) ENGINE=InnoDB ROW_FORMAT=COMPRESSED CHARACTER SET=utf8;
IoT platform (21k stars). Uses Cassandra for time-series telemetry, PostgreSQL for relational data.
Trigger: upgrade.sh script invokes ThingsboardInstallApplication (a separate Spring Boot entry point, not the normal server) with --fromVersion flag. Docker: docker compose run --rm -e UPGRADE_TB=true. (source)
Example (source):
ALTER TABLE calculated_field
  ADD COLUMN IF NOT EXISTS additional_info varchar;
These projects run migrations on end-user machines — across hundreds of millions of installations, with no DBA watching, no rollback capability, and users who may skip many versions between upgrades.
FirefoxMigrates bookmarks, history, cookies, permissions databases in C++/Rust.
Trigger: Auto on startup. InitSchema() reads GetSchemaVersion() and runs sequential MigrateVNUp() functions inside a transaction. Failure prevents Places from loading.
Example — adding a column and backfilling it (source):
nsresult Database::MigrateV54Up() {
  nsCOMPtr<mozIStorageStatement> stmt;
  nsresult rv = mMainConn->CreateStatement(
      "SELECT expire_ms FROM moz_icons_to_pages"_ns, getter_AddRefs(stmt));
  if (NS_FAILED(rv)) {
    rv = mMainConn->ExecuteSimpleSQL(
        "ALTER TABLE moz_icons_to_pages "
        "ADD COLUMN expire_ms INTEGER NOT NULL DEFAULT 0 "_ns);
    NS_ENSURE_SUCCESS(rv, rv);
  }
  rv = mMainConn->ExecuteSimpleSQL(
      "UPDATE moz_icons_to_pages SET expire_ms = "
      "strftime('%s','now','localtime','start of day','utc') * 1000 "
      "WHERE expire_ms = 0 "_ns);
  return NS_OK;
}
Same problem as Firefox, different implementation. Sequential if (cur_version == N) blocks.
Trigger: Auto on startup. HistoryDatabase::Init() → EnsureCurrentVersion() runs each version block up to the current version (70+). Version too new → INIT_TOO_NEW; migration failure → INIT_FAILURE.
Example (source):
if (cur_version == 15) {
  if (!db_.Execute("DROP TABLE starred") || !DropStarredIDFromURLs())
    return LogMigrationFailure(15);
  ++cur_version;
  std::ignore = meta_table_.SetVersionNumber(cur_version);
  std::ignore = meta_table_.SetCompatibleVersionNumber(
      std::min(cur_version, kCompatibleVersionNumber));
}
Encrypted SQLite database (SQLCipher). Migrations in TypeScript.
Trigger: Auto on startup. ts/sql/Server.node.ts opens the encrypted DB, then calls updateSchema(db, logger) which iterates SCHEMA_VERSIONS and applies each pending migration in a transaction. Only the primary worker runs migrations. (source)
Example (source):
import type { Database } from '@signalapp/sqlcipher';

export default function updateToSchemaVersion1090(db: Database): void {
  db.exec(`
    CREATE INDEX reactions_messageId ON reactions (messageId);
    CREATE INDEX storyReads_storyId ON storyReads (storyId);
  `);
}
Very few non-relational projects use an external migration framework — the ecosystem of reusable tooling is much thinner than in the relational world.
Mongock (MongoDB Migration Framework for Java) Appsmith (server-side)Low-code platform. Server-side uses Mongock with @ChangeUnit annotations. Also has a separate client-side DSL migration system (see 2B).
Trigger: Auto on Spring Boot startup. Mongock runs as a MongockInitializingBeanRunner bean, scanning for @ChangeUnit classes and executing them in order. Helm chart has no init container for migrations — they run inside the main app container. (source)
Example — converting a policies array to a keyed policyMap across 22 collections (source):
@ChangeUnit(order = "059", id = "policy-set-to-policy-map")
public class Migration059PolicySetToPolicyMap {
    private final ReactiveMongoTemplate mongoTemplate;

    @Execution
    public void execute() {
        Mono.whenDelayError(CE_COLLECTION_NAMES.stream()
                .map(c -> executeForCollection(mongoTemplate, c))
                .toList())
            .block();
    }
    // Uses ArrayToObject aggregation to transform policies[] → policyMap{}
}
Apple’s Java library powering iCloud/CloudKit — billions of independent databases sharing thousands of schemas. SIGMOD 2019 paper.
Trigger: Programmatic. Library consumers call FDBRecordStore.Builder#open() or #checkVersion(). A UserVersionChecker callback compares the stored metadata version in the database header against the current code’s metadata version and decides how to proceed. (source)
Example — adding a field to a record type via MetaDataProtoEditor (source):
public static void addField(@Nonnull RecordMetaDataProto.MetaData.Builder metaDataBuilder,
                            @Nonnull String recordType,
                            @Nonnull DescriptorProtos.FieldDescriptorProto field) {
    DescriptorProtos.DescriptorProto.Builder messageType =
        findMessageTypeByName(metaDataBuilder.getRecordsBuilder(), recordType);
    if (messageType == null) {
        throw new MetaDataException("Record type " + recordType + " does not exist");
    }
    messageType.addField(field);
}
And the evolution validator (source):
public void validate(@Nonnull RecordMetaData oldMetaData, @Nonnull RecordMetaData newMetaData) {
    if (oldMetaData.getVersion() > newMetaData.getVersion()) {
        throw new MetaDataException("new meta-data does not have newer version");
    }
    validateUnion(oldMetaData.getUnionDescriptor(), newMetaData.getUnionDescriptor());
    validateRecordTypes(oldMetaData, newMetaData, getTypeRenames(...));
    validateCurrentAndFormerIndexes(oldMetaData, newMetaData, typeRenames);
}
Canonical migration tool for the Neo4j ecosystem. Migrations are Cypher scripts or Java classes.
Trigger: Two paths: (1) neo4j-migrations migrate CLI, (2) Spring Boot auto-configuration — MigrationsInitializer implements InitializingBean and calls migrations.apply(true) in afterPropertiesSet(). (source)
Example — Cypher migration file, Flyway naming convention (source):
MATCH (n:BrokenData) DETACH DELETE n;
The migration runner (source):
private void apply0(List<Migration> migrations) {
    MigrationChain chain = this.chainBuilder.buildChain(this.context, migrations);
    for (Migration migration : IterableMigrations.of(this.config, migrations, optionalStop)) {
        migration.apply(this.context);
        recordApplication(chain.getUsername(), previousVersion, migration, executionTime);
    }
}
Almost every non-relational project has built its own migration infrastructure.
KV Store / Protobuf Schema Evolution (etcd) KubernetesObjects stored as protobufs in etcd. When the storage version for a resource type changes, existing objects need re-encoding.
Trigger: Create a StorageVersionMigration CRD. The kube-storage-version-migrator controller watches for these CRDs and does a paginated no-op PUT on every object, causing the API server to re-serialize in the new storage version. Deployed as a standalone in-cluster controller.
Example — API version conversion function for Deployments (source):
func Convert_v1_Deployment_To_apps_Deployment(in *appsv1.Deployment, out *apps.Deployment, s conversion.Scope) error {
    if err := autoConvert_v1_Deployment_To_apps_Deployment(in, out, s); err != nil {
        return err
    }
    // Deprecated rollbackTo field → annotation for roundtrip
    if revision := in.Annotations[appsv1.DeprecatedRollbackTo]; revision != "" {
        revision64, _ := strconv.ParseInt(revision, 10, 64)
        out.Spec.RollbackTo = &apps.RollbackConfig{Revision: revision64}
        delete(out.Annotations, appsv1.DeprecatedRollbackTo)
    }
    return nil
}
Underwent a major data model overhaul from v2 to v3. Built a dedicated calico-upgrade migration tool.
Trigger: calico-upgrade start CLI. Operator-initiated one-time migration with four phases: dry-run, start (pauses networking, converts all v1 objects to v3), complete, abort. (source)
Example — policy name conversion for etcd storage (source):
func convertPolicyNameForStorage(name string) string {
    if strings.HasPrefix(name, "knp.") {
        return name // Kubernetes-native policies keep their prefix
    }
    return "default." + name // Calico policies stored under "default" tier
}
CNCF Graduated MySQL clustering system (powers PlanetScale, Slack, GitHub). Stores topology metadata (keyspaces, shards, tablets, routing rules) as proto3 binary blobs in etcd. Schema evolution happens via standard protobuf rules — fields are only added, never removed or reordered — so stored objects remain readable across versions without any migration step. The topo2topo tool exists to copy topology between different backends (e.g., ZooKeeper → etcd) but this is a backend replacement, not a schema migration.
Trigger: No migration tooling needed. The protobuf encoding is forward- and backward-compatible by construction.
Example — protobuf-encoded topology object read from etcd (source):
func CopyKeyspaces(ctx context.Context, fromTS, toTS *topo.Server, parser *sqlparser.Parser) error {
    keyspaces, err := fromTS.GetKeyspaces(ctx)
    for _, keyspace := range keyspaces {
        ki, err := fromTS.GetKeyspace(ctx, keyspace)
        if err := toTS.CreateKeyspace(ctx, keyspace, ki.Keyspace); err != nil {
            if topo.IsErrType(err, topo.NodeExists) {
                log.Warn(fmt.Sprintf("keyspace %v already exists", keyspace))
            }
        }
    }
    return nil
}
Cloud-native API gateway. All dynamic runtime config (routes, upstreams, plugins, SSL certs) stored in etcd; static node config (listen ports, worker processes) remains in config.yaml on disk. The 2.x → 3.0 upgrade had incompatible etcd data structure changes with no automated migration.
Trigger: Entirely manual. etcdctl snapshot save, then either write custom scripts to transform JSON values in-place, or reconfigure from scratch via the 3.0 Admin API. No migration tooling provided. (docs)
Example — the breaking disable field relocation:
// 2.15.x — "disable" is top-level in each plugin
{ "plugins": { "limit-count": { "count": 2, "disable": true } } }

// 3.0.0 — "disable" must be nested under "_meta"
{ "plugins": { "limit-count": { "count": 2, "_meta": { "disable": true } } } }
CNCF Graduated distributed tracing. Versioned CQL templates parameterized by environment variables.
Trigger: create.sh shell script performs variable substitution and pipes CQL to cqlsh. In k8s, runs as a one-time Kubernetes Job using the jaegertracing/jaeger-cassandra-schema Docker image before deploying Jaeger. (k8s manifest)
Example (source):
CREATE TYPE IF NOT EXISTS ${keyspace}.keyvalue (
    key          text,
    value_type   text,
    value_string text,
    value_bool   boolean,
    value_long   bigint,
    value_double double,
    value_binary blob
);

CREATE TABLE IF NOT EXISTS ${keyspace}.traces (
    trace_id        blob,
    span_id         bigint,
    span_hash       bigint,
    operation_name  text,
    start_time      bigint,
    duration        bigint,
    PRIMARY KEY (trace_id, span_id, span_hash)
);
Team chat platform (45k stars). 300+ migrations. Control document tracks version + lock state.
Trigger: Auto on every startup. xrun.ts calls performMigrationProcedure() → migrateDatabase('latest'). All versioned migration modules (v293–v335) are imported at startup. (source)
Example (source):
import { Settings } from '@rocket.chat/models';
import { addMigration } from '../../lib/migrations';

addMigration({
    version: 309,
    name: 'Remove unused UI_Click_Direct_Message setting',
    async up() {
        await Settings.removeById('UI_Click_Direct_Message');
    },
});
Per-document version stamps. 94 sequential migration functions for widget DSL. Runs in the browser, not the server.
Trigger: On every page load. extractCurrentDSL() calls migrateDSL(currentDSL), which runs every if (version === N) block from the stored version up through 94. The upgraded DSL is never written back — migrations re-execute on every load. (source)
Example — migrating legacy styling enums to CSS tokens (source):
enum ButtonBorderRadiusTypes { SHARP = "SHARP", ROUNDED = "ROUNDED", CIRCLE = "CIRCLE" }
const THEMING_BORDER_RADIUS = { none: "0px", rounded: "0.375rem", circle: "9999px" };

export const migrateStylingPropertiesForTheming = (currentDSL: DSLWidget) => {
  // walks every widget, rewrites legacy enum-style borderRadius / boxShadow
  // to CSS token strings used by the theming system
};
Log management (since 2010). 91 timestamped Java migration classes. Leader-gated.
Trigger: Auto on startup via ServerBootstrap.runMigrations(). Only runs on the leader node (checked via configuration.isLeader()). Three phases: PREFLIGHT, STANDARD, and ENFORCED_ON_ALL_NODES. No separate k8s job. (source)
Example (source):
public class V20190705071400_AddEventIndexSetsMigration extends Migration {
    @Override
    public ZonedDateTime createdAt() {
        return ZonedDateTime.parse("2019-07-05T07:14:00Z");
    }

    @Override
    public void upgrade() {
        ensureEventsStreamAndIndexSet("Events",
            "Stores events created by event definitions.",
            elasticsearchConfiguration.getDefaultEventsIndexPrefix(),
            Stream.DEFAULT_EVENTS_STREAM_ID, "All events");
    }
}
Reactive JavaScript database for client-side apps. Each collection carries a schema version with migrationStrategies functions.
Trigger: Auto when a collection is opened (if autoMigrate: true, the default). createRxCollection() detects a lower stored schema version and calls migratePromise(). Runs in the browser per-device; awaits leader election in multi-instance databases. (source)
Example — migration strategies and the core iteration loop (source):
// Defining strategies at collection creation
migrationStrategies: {
  1: function(oldDoc) {
    oldDoc.time = new Date(oldDoc.time).getTime(); // string → unix
    return oldDoc;
  },
  2: function(oldDoc) {
    if (oldDoc.time < 1486940585) return null; // deletes document
    return oldDoc;
  }
}

// Core iteration in migration-helpers.ts
let nextVersion = docSchemaVersion + 1;
while (nextVersion <= collection.schema.version) {
    currentPromise = currentPromise.then(docOrNull =>
        runStrategyIfNotNull(collection, nextVersion, docOrNull));
    nextVersion++;
}
CouchDB-based offline-first health apps used by tens of thousands of health workers in dozens of countries.
Trigger: Two-track. App-level migrations (in api/src/migrations/) auto-run on API startup — the server is unavailable (502) until complete. Cluster-level migrations (3.x → 4.x) require manually running the couchdb-migration Docker tool before upgrading. (docs)
Example — removing a field from CouchDB documents via bulkDocs (source):
module.exports = {
  name: 'remove-enabled-from-translation-docs',
  created: new Date('2025-09-01'),
  run: async () => {
    const translationDocs = await translations.getTranslationDocs();
    translationDocs.forEach(doc => delete doc.enabled);
    await db.medic.bulkDocs(translationDocs);
  }
};
CNCF Prometheus long-term storage. Time-partitioned schema versioning — you never migrate old data.
Trigger: No data migration. Append a new PeriodConfig block to the YAML config with a future from: date and new schema: version. At runtime, SchemaForTime(timestamp) selects the correct config for each chunk. Old and new schema tables coexist indefinitely. (original PR)
Example — the schema dispatch function (now maintained in Grafana Loki, same code) (source):
type PeriodConfig struct {
    From   DayTime `yaml:"from"`
    Schema string  `yaml:"schema"` // e.g. "v10", "v11"
}

func (cfg SchemaConfig) SchemaForTime(t model.Time) (PeriodConfig, error) {
    for i := range cfg.Configs {
        if t >= cfg.Configs[i].From.Time &&
            (i+1 == len(cfg.Configs) || t < cfg.Configs[i+1].From.Time) {
            return cfg.Configs[i], nil
        }
    }
    return PeriodConfig{}, fmt.Errorf("no schema config found for time %v", t)
}
Backend for Signal Private Messenger. Uses DynamoDB as primary store. Schema evolution is implicit — most data lives inside a JSON blob attribute.
Trigger: No schema migration. New fields are added to the Account POJO and written into the D (data) attribute on next update. A per-item V (version) attribute provides optimistic locking. Table/GSI changes are provisioned externally via infrastructure-as-code, not application code. (source)
Example — optimistic locking on DynamoDB writes (source):
static final String ATTR_VERSION = "V";

// Every update atomically increments version and checks the condition
updateExpressionBuilder.append(" ADD #version :version_increment");

return new UpdateAccountSpec(accountTableName,
    Map.of(KEY_ACCOUNT_UUID, AttributeValues.fromUUID(account.getUuid())),
    attrNames, attrValues,
    updateExpressionBuilder.toString(),
    "attribute_exists(#number) AND #version = :version");  // conditional write
When deploying a new GraphQL schema, Dgraph updates the schema in memory immediately but does not alter existing data — index rebuilds run asynchronously in the background.
Trigger: POST /admin with an updateGQLSchema mutation, or dgraph live --schema. The change propagates to all cluster nodes via Raft. If a predicate’s tokenizer changed, a background goroutine iterates all existing postings in Badger and writes new index entries. (source)
Example — schema mutation with conditional async index rebuild (source):
rebuild := posting.IndexRebuild{
    Attr: su.Predicate, StartTs: startTs,
    OldSchema: &old, CurrentSchema: su,
}

// Write new schema to memory immediately (queries see it now)
schema.State().Set(su.Predicate, rebuild.GetQuerySchema())

if rebuild.NeedIndexRebuild() {
    go buildIndexes(su, rebuild, closer) // async background reindex
} else {
    updateSchema(su, rebuild.StartTs)    // write to Badger, done
}
Openclaw is Spam, Like Any Other Automated Email
Open Source communities are trying to quickly adapt to the present rapid advances in technology. I would like to propose some clarity around something that should be common sense.
Automated emails are spam. They always have been. Openclaw (and whatever new thing surfaces this summer) is no different.
Policies saying automated emails/messages are banned – including anything AI generated – are not only common-sense policies, they aren’t even a change from how we’ve always worked. This includes automated comments on github issues, automated PRs, automated patch submissions, and even any kind of automated review. Copilot automated reviews, snyk, etc – are ok if-and-only-if it’s configured by the owners of the repo/project. Common sense.
Enforcement of these policies – more than ever – depends on trust and relationships. I do think, for example, that non-native-english-speakers should be allowed to use AI to help them check their english. Used responsibly, AI tools can help a lot with language learning! Your grammar checker is probably based on some kind of LLM anyway. But I’m saying that a human always presses the “send” button on the message, and this human is responsible for the words they sent. If moderators suspect automated messages, every open source project should have a policy they can cite for blocking/banning the account.
Tomas Vondra’s article “the AI inversion” is the latest of many good and thought-provoking pieces I’ve read – it’s well worth the read – although he’s getting at deeper problems than what I’m writing about here – and he has very good reasons to have a much deeper level of concern for the impact of AI tooling on open source communities. These are interesting times and we don’t have all the answers yet.
A few more things I’ve recently read, which I think are good:
- CloudNativePG AI policy – https://github.com/cloudnative-pg/governance/blob/main/AI_POLICY.md
- Linux Foundation AI Policy – https://www.linuxfoundation.org/legal/generative-ai
- Bryan Cantrill, Oxide RFD – https://rfd.shared.oxide.computer/rfd/0576
- Russ Cox on GoLang and AI – https://groups.google.com/g/golang-dev/c/4Li4Ovd_ehE/m/8L9s_jq4BAAJ?pli=1
- Jordan Tigani about AI @ MotherDuck – [long painful URL for LinkedIn post]
.
I’ve also been writing bits and pieces of partial thoughts over the past week or two – my short blog post about the Scott Shambaugh situation (And thank you to Kim Bruning for the thoughtful email exchanges about this blog! Please continue to keep this old guy on his toes, reasoning through things, and challenging his thinking!)
There have been a bunch of LinkedIn messages too; capturing them here:
- Mischa van den Burg wrote a LinkedIn post about whether ChatGPT in interviews is a red flag
- Brad Nicholson said “As someone that knows how to find that sort of info command line and has done so many, many times – I’d go to chat first, google second and the man pages last because the first two get me what I need faster than reading a man page.”
. - Replying to Brad:
“I do the same thing, but we also understand this is in descending order of hallucination likelihood
one of my favorite ways to use agents is to write me a script that demonstrates a behavior they claim… by the time the script is working, the claim is often significantly revised – and at present i still usually have to prevent them from making the test script work by moving the goalposts”
.
- Brad Nicholson said “As someone that knows how to find that sort of info command line and has done so many, many times – I’d go to chat first, google second and the man pages last because the first two get me what I need faster than reading a man page.”
- Replying to Phil Eaton’s post about Russ Cox’s perspective on golang project approach (policy?) for AI:
- Russ Cox’s message is here
- i said “yes – the section here is a good excerpt” (referring to Phil’s excellent choice of what to screenshot)
.
- Replying to Kelsey Hightower’s post “Generative AI is a slop generation machine by default. You have to put in a lot of work to get something of quality from it.”
- It’s the same work I did before, just shifted left. I’m iterating on low-level detailed design spec and autogenerating code, rather than iterating on the code and trying to keep design docs in sync. I think of it as writing more of my code in detailed prose, flowcharts, sequence diagrams, and pseudocode – rather than writing it directly in the programming language and manually keeping the design docs in sync. But it’s the same work, minus time spent on syntax (which was never where the value was).
. - Replying to Adam Jacob’s comment: I think it remains true that “you get out what you put in”
.
- It’s the same work I did before, just shifted left. I’m iterating on low-level detailed design spec and autogenerating code, rather than iterating on the code and trying to keep design docs in sync. I think of it as writing more of my code in detailed prose, flowcharts, sequence diagrams, and pseudocode – rather than writing it directly in the programming language and manually keeping the design docs in sync. But it’s the same work, minus time spent on syntax (which was never where the value was).
- Replying to Jordan Tigani’s post about MotherDuck AI policy:
- Tricky topic. I built a deeply detailed design for overhauling how auth works on a core platform…
* 291 prompts across 15 sessions over 3 days, comprising ~1,226 lines of prompt text
* final design document is 1,904 lines of markdown — a ratio of roughly 2 lines of human-written prompt for every 3 lines of design document output
a review of the full transcript showed a number of interesting characteristics of my prompts, including:
* Persistent effort to simplify the tool’s initial proposals
* Directly contributing critical domain knowledge
* Frequent insistence on precise terminology
Overall I’m satisfied and I think it’s a good doc that would have taken me 10x longer otherwise (especially research portions) – but I acknowledge mixed feelings.
one thing that’s clear: i obviously got the AI game backwards. i thought it was scored like golf, where a lower ratio of input-to-output is a better score
.
- Tricky topic. I built a deeply detailed design for overhauling how auth works on a core platform…
- My own LinkedIn post: “We need to re-think OSS contribution attribution in light of AI. More than ever, it’s important for committers to give credit on where the ideas are coming from. A committer can copy/paste someone else’s ideas into their own prompts, and they need to give appropriate credit.”
. - Mentioning the Oxide RFD in my reply to Daniel Gustafsson:
- my thought is around crediting someone who participates meaningfully in the discussion, even if they didn’t author the final patch. a wall of text email that nobody entirely reads is not a meaningful contribution – but there are lots of ways AI can be part of a well-written email. it’s hard to find the objective line though about what this means.
email moderation is going to get harder. trust and relationships were always important, and now even more so. i think using AI for research or to assist with writing is a net positive – as long as the final written product is concise and well-communicated and understood by the author. AI is the tool, but it’s finally still a human relationship. oxide’s RFD is good https://rfd.shared.oxide.computer/rfd/0576 – responsibility, rigor and empathy remain fundamental. old-school email lists might have a small advantage here. and i hope we can stay open to new people who seem interested to join and contribute
.
- my thought is around crediting someone who participates meaningfully in the discussion, even if they didn’t author the final patch. a wall of text email that nobody entirely reads is not a meaningful contribution – but there are lots of ways AI can be part of a well-written email. it’s hard to find the objective line though about what this means.
- Replying to Adam Jacob’s post: “If you’re thinking to yourself “this 10x increase in capability to create software doesn’t matter, because writing software was never the bottleneck”, you’re drawing the wrong conclusions from a true statement. … [skipping middle section, but go read the whole thing bc its good] … We will rebuild everything around this capability. Everything.”
- what people miss: it doesn’t need to be 10x more code, it can be same code 10x faster (which often is very little code — but it would have taken much longer to get it right)
but Adam why are you telling everyone? i’m having so much fun right now, and once everyone figures it out then we’ll be back to the usual drill…
.
- what people miss: it doesn’t need to be 10x more code, it can be same code 10x faster (which often is very little code — but it would have taken much longer to get it right)
- I wrote a LinkedIn post about how I think moderation will get harder, then clarified a bit in reply to Andreas Scherbaum by pointing to Tomas Vondra’s blog because that’s much better than what I said.
.
The Scott Shambaugh Situation Clarifies How Dumb We Are Acting
Edit: related blog published Feb 22 – Openclaw is Spam, Like Any Other Automated Email
My personal blog here is dedicated to tech geek material, mostly about databases like postgres. I don’t get political, but at the moment I’m so irritated that I’m making the extraordinary exception to veer into the territory of flame-war opinionating…
This relates to Postgres because Scott is a volunteer maintainer on an open source project called matplotlib and the topic is something that we are all navigating in the open source space. Last night at the Seattle Postgres User Group meetup Claire Giordano gave a presentation about how the postgres community works and this was one of the first topics that came up in the Q&A at the end! Like every open source project, Postgres is trying to figure out how to deal with the rapid change of the industry as new, powerful, useful AI tools enable us to do things we couldn’t do before (which is great). Just two weeks ago, the CloudNativePG project released an AI Policy which builds on work from the Linux Foundation and discussion around the Ghostty policy. We’re in the middle of figuring this out and we’re working hard.
Just now, I saw this headline on the front page of the Wall Street Journal:

I personally find this to be outright alarming. And it’s the most clear expression that I’ve seen of deeply wrong, deeply concerning language we’ve all been observing. Many of us in tech communities are complicit in this, and now even press outlets like the WSJ are joining us in complicity.
Corrected headline: Software Engineer Responsible for Bullying, Due to Irresponsible Use of AI, Has Not Yet Apologized
This article uses language I hear people use all the time in the tech community: Several hours later, the bot apologized to Shambaugh for being “inappropriate and personal.”
This language basically removes accountability and responsibility from the human, who configured an AI agent with the ability to publish content that looks like a blog with zero editorial control – and I haven’t looked deeply but it seems like there may not be clear attribution of who the human is, that’s responsible for this content.
We all need to collectively take a breath and stop repeating this nonsense. A human created this, manages this, and is responsible for this.
It’s one thing when I hear this dumb language on LinkedIn, but I’m alarmed to see it on the front page of a major media outlet like the journal.
Our contributions to dialogue in the tech industry – on LinkedIn, at meetups, with coworkers, at conferences, on other social media, etc – these all make small contributions to our culture. Poor American culture seems in a weird cycle sometimes of taking a very long time to acknowledge very common-sense things, because vested interests (often with much financial motivation) want to push a certain narrative and everyone knows it’s bunk but nobody says so. Personally i think this applies to a wide array of issues, not just tech.
Folks, please speak up about stuff that’s stupid obvious. Bullying of open source maintainers should be alarming to us, and whoever the person is that’s responsible for this needs to step up and take responsibility. Personally.
And we all need to dial back this over-the-top anthropomorphizing of useful electronic gadgets that we’re building and selling.
How Blocking-Lock Brownouts Can Escalate from Row-Level to Complete System Outages
This article is a shortened version. For the full writeup, go to https://github.com/ardentperf/pg-idle-test/tree/main/conn_exhaustion
This test suite demonstrates a failure mode when application bugs which poison connection pools collide with PgBouncers that are missing peer config and positioned behind a load balancer. PgBouncer’s peering feature (added with v1.19 in 2023) should be configured if multiple PgBouncers are being used with a load balancer – this feature prevents the escalation demonstrated here.
The failures described here are based on real-world experiences. While uncommon, this failure mode has been seen multiple times in the field.
Along the way, we discover unexpected behaviors (bugs?) in Go’s database/sql (or sqlx) connection pooler with the pgx client and in Postgres itself.
Sample output: https://github.com/ardentperf/pg-idle-test/actions/workflows/test.yml
The Problem in BriefGo’s database/sql allows connection pools to become poisoned by returning connections with open transactions for re-use. Transactions opened with db.BeginTx() will be cleaned up, but – for example – conn.ExecContext(..., "BEGIN") will not be cleaned up. PR #2481 proposes some cleanup logic in pgx for database/sql connection pools (not yet merged); I tested the PR with this test suite. The PR relies on the TxStatus indicator in the ReadyForStatus message which Postgres sends back to the client as part of its network protocol.
A poisoned connection pool can cause an application brownout since other sessions updating the same row wait indefinitely for the blocking transaction to commit or rollback its own update. On a high-activity or critical table, this can quickly lead to significant pile-ups of connections waiting to update the same locked row. With Go this means context deadline timeouts and retries and connection thrashing by all of the threads and processes that are trying to update the row. Backoff logic is often lacking in these code paths. When there is a currently running SQL (hung – waiting for a lock), pgx first tries to send a cancel request and then will proceed to a hard socket close.
If PgBouncer’s peering feature is not enabled, then cancel requests load-balanced across multiple PgBouncers will fail because the cancel key only exists on the PgBouncer that created the original connection. The peering feature solves the cancel routing problem by allowing PgBouncers to forward cancel requests to the correct peer that holds the cancel key. This feature should be enabled – the test suite demonstrates what happens when it is not.
Postgres immediately cleans up connections when it receives a cancel request. However, Postgres does not clean up connections when their TCP sockets are hard closed, if the connection is waiting for a lock. As a result, Postgres connection usage climbs while PgBouncer continually opens new connection that block on the same row. The app’s poisoned connection pool quickly leads to complete connection exhaustion in the Postgres server.
Existing connections will continue to work, as long as they don’t try to update the row which is locked. But the row-level brownout now becomes a database-level brownout – or perhaps a complete system outage (once the Go database/sql connection pool is exhausted) – because postgres rejects all new connection attempts from the application.
Result: Failed cancels → client closes socket → backends keep running → CLOSE_WAIT accumulates → Postgres hits max_connections → system outage
- The Problem in Brief
- Table of Contents
- Architecture
- The Test Scenarios
- Test Results
- Detection and Prevention
The test uses Docker Compose to create this infrastructure with configurable number of PgBouncer instances.
The Test Scenariostest_poisoned_connpool_exhaustion.sh accepts three parameters: <num_pgbouncers> <poison|sleep> <peers|nopeers>
In this test suite:
- The failure is injected 20 seconds after the test starts.
- Idle connections are aborted and rolled back after 20 seconds.
- Postgres is configured to abort and rollback any and all transactions if they are not completed within 40 seconds. Note that the
transaction_timeoutsetting (for total transaction time) should be used cautiously, and is available in Postgres v17 and newer.
TPS is the best indicator of actual application impact. It’s important to notice that PgBouncer peering does not prevent application impact from either poisoned connection pools or sleeping sessions. The section below titled “Detection and Prevention” has ideas which address the actual root cause and truly prevent application impact.

After the lock is acquired at t=20, TPS drops from ~700 to near zero in all cases as workers block on the locked row held by the open transaction.
Sleep mode (orange/green lines): Around t=40, Postgres’s idle_in_transaction_session_timeout (20s) fires and kills the blocking session. TPS recovers to ~600-700.
Poison mode (red/purple/blue lines): The lock-holding connection is never idle—it’s constantly being picked up by workers attempting queries—so the idle timeout never fires. TPS remains near zero until Postgres’s transaction_timeout (40s) fires at t=60, finally terminating the long-running transaction and releasing the lock.
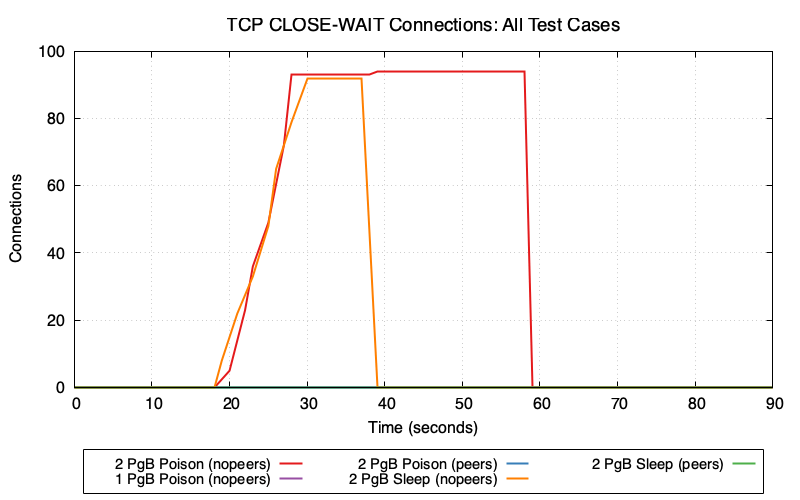
2 PgBouncers (nopeers) (red/orange lines): CLOSE_WAIT connections accumulate rapidly because:
- Cancel request goes to wrong PgBouncer → fails
- Client gives up and closes socket
- Server backend is still blocked on lock, hasn’t read the TCP close
- Connection enters CLOSE_WAIT state on Postgres
In poison mode (red), CLOSE_WAIT remains at ~95 until transaction_timeout fires at t=60. In sleep mode (orange), CLOSE_WAIT clears around t=40 when idle_in_transaction_session_timeout fires.
1 PgBouncer and peers modes (purple/blue/green lines): Minimal or zero CLOSE_WAIT because cancel requests succeed—either routing to the single PgBouncer or being forwarded to the correct peer.
Connection Pool Wait Time vs PgBouncer Client WaitGo’s database/sql pool tracks how long goroutines wait to acquire a connection (db.Stats().WaitDuration). PgBouncer tracks cl_waiting—clients waiting for a server connection. These metrics measure wait time at different layers of the stack.
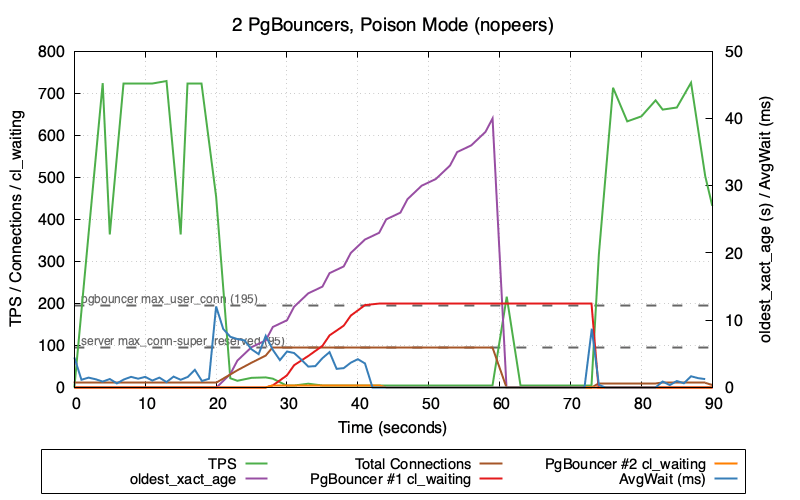
This graph shows 2 PgBouncers in poison mode (nopeers)—the worst-case scenario:
- TPS (green) crashes to near zero and stays there until
transaction_timeoutfires at t=60 - oldest_xact_age (purple) climbs steadily from 0 to 40 seconds
- Total Connections (brown) climb rapidly after poison injection at t=20 as failed cancels leave backends in CLOSE_WAIT
- Once Postgres hits
max_connections - superuser_reserved_connections (95), new connections are refused - PgBouncer #1 cl_waiting (red) and PgBouncer #2 cl_waiting (orange) then spike as clients queue up waiting for available connections
Note the gap between when transaction_timeout fires (t=60, visible as oldest_xact_age dropping to 0) and when TPS fully recovers. TPS recovery correlates with cl_waiting dropping back to zero—PgBouncer needs time to clear the queue of waiting clients and re-establish healthy connection flow. This recovery gap only occurs in nopeers mode; the TPS comparison graph shows that peers mode recovers immediately when the lock is released because connections never exhaust and cl_waiting stays at zero.
Why is AvgWait (blue) so low despite the system being in distress? The poisoned connection (holding the lock) continues executing transactions without blocking—it already holds the lock, so its queries succeed immediately. This one connection cycling rapidly through the pool with sub-millisecond wait times heavily skews the average lower, masking the fact that other connections are blocked.
The cl_waiting metric is collected as cnpg_pgbouncer_pools_cl_waiting from CloudNativePG. See CNPG PgBouncer metrics.
Monitoring and Alerting:
Alert on:
- Most Important:
cnpg_backends_max_tx_duration_secondsshowing transactions open for longer than some threshold cnpg_backends_totalshowing established connections at a high percentage ofmax_connections- Number of backends waiting on locks over some threshold
-- Count backends waiting on locks
SELECT count(*) FROM pg_stat_activity WHERE wait_event_type = 'Lock';
Prevention Options:
Options to prevent the root cause (connection pool poisoning):
- Find and fix connection leaks in the application – ensure all transactions are properly committed or rolled back
- Use
OptionResetSessioncallback – automatically discard leaked connections (see below) - Fix at the driver level – PR #2481 proposes automatic detection in pgx (not yet merged)
Options to prevent the escalation from row-level brownout to system outage:
- Enable PgBouncer peering – if using multiple PgBouncers behind a load balancer, configure the
peer_idand[peers]section so cancel requests are forwarded to the correct instance (see PgBouncer documentation). This prevents connection exhaustion but does not prevent the TPS drop from lock contention. - Use session affinity (sticky sessions) in the load balancer based on client IP – ensures cancel requests route to the same PgBouncer as the original connection (see HAProxy Session Affinity example below)
Options to limit the duration/impact:
- Set appropriate timeout defaults – configure system-wide timeouts to automatically terminate problematic sessions:
idle_in_transaction_session_timeout– terminates sessions idle in a transaction (e.g.,5min)transaction_timeout(Postgres 17+) – use caution; limits total transaction duration regardless of activity (e.g.,30min)
Potential Postgres Enhancement:
This would not address the root cause, but Postgres could better handle CLOSE_WAIT accumulation by checking socket status while waiting for locks. Since Postgres already checks for interrupts periodically (which is why cancels work), it’s possible that similar logic could detect forcibly closed sockets and clean up blocked backends sooner.
Results Summary, Understanding the Layers Leading to the System Outage, Unique Problems, and more - available in the full writeup at https://github.com/ardentperf/pg-idle-test/tree/main/conn_exhaustion
Postgres Booth at PASS Data Community Summit
PASS Data Community Summit 2025 wrapped up last week. This conference originated 25 years ago with the independent, user-led, not-for-profit “Professional Association for SQL Server (PASS)” and the annual summit in Seattle continues to attract thousands of database professionals each year. After the pandemic it was reorganized and broadened as a “Data Community” event, including a Postgres track.
Starting in 2023, volunteers from the Seattle Postgres User Group have staffed a postgres community booth on the exhibition floor. We provide information about Postgres User Groups around the world and do our best to answer all kinds of questions people have about Postgres. The booth consistently gets lots of traffic and questions.
The United States PostgreSQL Association has generously supplied one of their booth kits each year, which has a banner/background and some booth materials like stickers and a map with many user groups and a “welcome to postgres” handout and postgres major version handouts. We supplement with extra pins and stickers and printouts like the happiness hints I’ve put together, a list of common extensions that Rox made, and a list of Postgres events that Lloyd made. Every year, we also bring leftover Halloween candy that we want to get rid of and we put it in a big bowl on the table.
One of the top questions people ask is how and where they can learn more about Postgres. Next year I might just print out the Links section from my blog, which has a bunch of useful free resources. Another idea I have is for Redgate and EnterpriseDB – I think both of these companies have paid training but also give free access to a few introductory classes – it would be nice if they made a small card with a link to their free training. I think we could have a stack of these cards at our user groups and at the PASS booth. The company can promote paid training, but the free content can benefit anyone even if they aren’t interested in the paid training. I might also reach out to other companies who have paid training and see if they’d be willing to open up a bit of pre-recorded introductory content for free. (Data Egret? Creston Jamison?) Come to think of it, a list of weekly newsletters and podcasts might also be a great thing to print on a handout or a card – Postgres Weekly, postgres.fm, Talking Postgres, Scaling Postgres, etc.
The disk in the picture below is not from our booth; it’s an original SQL server installation disk and the crew over at Fortified apparently found a whole box of them on eBay and were handing them out over at their booth. As a result, I overheard someone explaining to another conference attendee what is a “floppy disk” and why does the bottom open. (In the background, on our booth table, you can see that I “fixed” the DocumentDB sticker…)

This year, I took my home office white board and drove it down to the convention center along with a bunch of magnets. Rick Lowe’s wife Becka picked up two wall-mount metal mesh file organizers and four S-hooks, which we hung on the white board and filled with handouts that Ben Chobot printed on his home printer. Thank you! This worked really well and you can see it in the picture below. It freed up space on the table for other things like pins and stickers, the raffle, and a very cool elephant that Lloyd brought.

As always: a huge shout-out to our local volunteers! From the left in the picture below: Lloyd Albin, me, Ben Chobot, Deon Gill, Rick Lowe, and… Pavlo Golub who is not technically local but joined us for our volunteer dinner/hangout! Harry Pierson missed our volunteer dinner but he’s on the right side in the booth picture above.

We raffled off a signed copy of Ryan Booz and Grant Fritchey’s new book: Introduction to PostgreSQL for the data professional. Congratulations to our winner – Tomi from Croatia!

Most of my time was at the booth. I had one speaking session on Friday, and spoke about CloudNativePG Quorum Failover. I originally intended to just expand the talk from KubeCon the week before. But I ended up heavily re-writing after realizing that out of 242 sessions at PASS there were only 6 that even mentioned Kubernetes. I ended up spending the first half of the talk with a simple introduction to containers and Kubernetes – a couple slides and then a terminal window with docker and kind to demonstrate the basics.
Finally, it was great fun to catch up with some old Oracle friends like Kellyn Gorman, Gustavo René Antúnez, Shane Borden and Gleb Otochkin. And of course it was great to see Lukas Fitl and Ryan Booz and Grant Fritchey. These are all solid, amazing people and if you ever see them at a conference then don’t hesitate to introduce yourself and strike up a conversation!
I enjoy traveling for conferences but I’m still in a season of limited travel for family reasons (and probably will be for awhile) – so I look forward to any time Postgres people visit Seattle. Helping organize the Postgres booth for PASS is a bit of work, but it’s worthwhile for the chance to connect. I look forward to seeing the Postgres track grow at PASS Data Community Summit!
KubeCon 2025: Bookmarks on Memory and Postgres
Just got home from KubeCon.
One of my big goals for the trip was to make some progress in a few areas of postgres and kubernetes – primarily around allowing more flexible use of the linux page cache and avoiding OOM kills with less hardware overprovisioning. When I look at Postgres on Kubernetes, I think there are idle resources (both memory and CPU) on the table with the current Postgres deployment models that generally use guaranteed QoS.
Ultimately this is about cost savings. I think we can still run more databases on less hardware without compromising the availability and reliability of our database services.
The trip was a success, because I came home with lots of reading material and homework!
Putting a few bookmarks here, mostly for myself to come back to later:
- key place for discussion is sig-node
- documentation on node-pressure eviction https://kubernetes.io/docs/concepts/scheduling-eviction/node-pressure-eviction/
- eviction signal thresholds can be customized
- it looks like priority classes give a lot of control over the order in which pods are evicted
- documentation on priority classes https://kubernetes.io/docs/concepts/scheduling-eviction/pod-priority-preemption/
- cgroups v2 memory controller documentation https://docs.kernel.org/admin-guide/cgroup-v2.html#memory
- long running github issue about pod evictions due to kubernetes (incorrectly?) interpreting active page cache as working memory that won’t be reclaimed https://github.com/kubernetes/kubernetes/issues/43916
- new feature MemoryQOS – still alpha (feature gate off-by-default)
- KEP https://github.com/kubernetes/enhancements/tree/master/keps/sig-node/2570-memory-qos/
- currently stalled – related message from Linux Kernel Mailing Lists https://lkml.org/lkml/2023/6/1/1300
- “Future: memory.high can be used to implement kill policies in for userspace OOMs, together with Pressure Stall Information (PSI). When the workloads are in stuck after their memory usage levels reach memory.high, high PSI can be used by userspace OOM policy to kill such workload(s).”
- Nov 2021 blog https://kubernetes.io/blog/2021/11/26/qos-memory-resources/
- May 2023 blog https://kubernetes.io/blog/2023/05/05/qos-memory-resources/
- Brief mention in docs https://kubernetes.io/docs/concepts/workloads/pods/pod-qos/#memory-qos-with-cgroup-v2
- KEP https://github.com/kubernetes/enhancements/tree/master/keps/sig-node/2570-memory-qos/
- metrics added to CAdvisor for both active and inactive page cache https://github.com/google/cadvisor/pull/3445
- metric added for PSI https://kubernetes.io/blog/2025/09/04/kubernetes-v1-34-introducing-psi-metrics-beta/
- homework – taking a closer look at anonymous memory and page cache metrics (both active and inactive) for real postgres databases on kubernetes
- homework – set up tests that emulate the diagram below and demonstrate the eviction behavior that i think will happen
I still have a lot of catching up to do. I sketched out the diagram below, but please take this with a large grain of salt – this aspect of kubernetes is complex and linux memory management is complex:

I tried to summarize some thoughts in a comment on the long-running github issue, but this might be wrong – it’s just what I’ve managed to piece together so far.
.
My “user story” is that (1) I’d like higher limit and more memory over-commit for page cache specifically – letting linux use available/unused memory as needed for page cache and (2) I’d like lower request to get scheduling closer to actual anonymous memory needs. I’m running Postgres. In the current state, I have to simultaneously set an artificially low limit on per-pod page cache (to avoid eviction) and artificially high request on per-pod anonymous memory (to avoid OOM by getting oom_score_adj). I’d like individual pods able to burst anonymous memory usage (eg. an unexpected SQL query that hogs memory), if we can steal from page cache of other pods beyond their request – avoiding OOM. The linux kernel can do this; I think it should be possible with the right cgroup settings?
It seems like the new Memory QOS feature might be assigning a static calculated value to memory.high – but for page cache usage, I wonder if we actually want kubernetes to dynamically adjust memory.high eventually as low as request in an attempt to reclaim node-level resources – before evicting end-user pods – when the memory.available eviction signal has exceeded the threshold?
Anyway it’s also worth pointing out that the postgres problems are likely accentuated by higher concentrations of postgres on nodes; if databases are spread across large multi-tenant clusters that likely mitigates things a bit.
Edit 11/29: Alexey Demidov replied on the github issue and pointed out the problem; the linux kernel throttles CPU of processes when we use memory.high so this probably makes my idea above ineffective.
Explaining IPC:SyncRep – Postgres Sync Replication is Not Actually Sync Replication
Postgres database-level “synchronous replication” does not actually mean the replication is synchronous. It’s a bit of a lie really. The replication is actually – always – asynchronous. What it actually means is “when the client issues a COMMIT then pause until we know the transaction is replicated.” In fact the primary writer database doesn’t need to wait for the replicas to catch up UNTIL the client issues a COMMIT …and even then it’s only a single individual connection which waits. This has many interesting properties.
One benefit is throughput and performance. It means that much of the database workload is actually asynchronous – which tends to work pretty well. The replication stream operates in parallel to the primary workload.
But an interesting drawback is that you can get into situations where the primary can speed ahead of the replica quite a bit before that COMMIT statement hits and then the specific client who issued the COMMIT will need to sit and wait for awhile. It also means that bulk operations like pg_repack or VACUUM FULL or REFRESH MATERIALIZED VIEW or COPY do not have anything to throttle them. They will generate WAL basically as fast as it can be written to the local disk. In the mean time, everybody else on the system will see their COMMIT operations start to exhibit dramatic hangs and will see apparent sudden performance drops – while they wait for their commit record to eventually get replicated by a lagging replication stream. It can be non-obvious that this performance degradation is completely unrelated to the queries that appear to be slowing down. This is the infamous IPC:SyncRep wait event.
Another drawback: as the replication stream begins to lag, the amount of disk needed for WAL storage balloons. This makes it challenging to predict the required size of a dedicated volume for WAL. A system might seem to have lots of headroom, and then a pg_repack on a large table might fill the WAL volume without warning.
This is a bit different from storage-level synchronous replication. With storage-level replication, each IO operation performing a write to the disk needs to be replicated. Postgres has a single WAL stream – so if any connection issues a COMMIT then postgres will immediately fsync the entire WAL stream up to that point – including all of the WAL for the bulk operation. In this way, the fsync works a little bit like the IPC:SyncRep wait – however I have a sense that fsync somehow introduces more backpressure into the system as a whole and likely provides at least a small amount of healthy throttling for large bulk operations.
When your workload consists ONLY of small short transactions, Postgres database-level replication can work really well and there’s back-pressure that keeps the database system in equilibrium. This Postgres database won’t lag because each individual transaction pauses. The problem is when you start injecting those big bulk operations with no back-pressure to throttle them.
This is also the reason why autovacuum_vacuum_cost_delay of zero can cause chaos and is a bad idea; it unleashes a vacuum running at full speed and generates massive & bursty amounts of WAL for large busy tables, as fast as it can write to the disk.
If you’re seeing the IPC:SyncRep wait event then one of the first things you should do is analyze your WAL activity. Something along these lines might be useful, if you’re debugging in real time (or add something similar to your monitoring system):
psql --csv -Xtc "create extension pg_walinspect"
psql --csv -Xtc "select now(),pg_current_wal_lsn()"  >>wal-data.csv

while true; do
  NEXTWAL=$(grep ^2025 wal-data.csv|tail -1|cut -d, -f2)
  psql --csv -c "SELECT now(),pg_current_wal_lsn(),*
          FROM pg_get_wal_stats('$NEXTWAL', pg_current_wal_lsn())" >>wal-data.csv
  echo $(date) - $NEXTWAL
  sleep 1
done
One potential idea for fixing this would be to add code into postgres vacuum and refresh materialized view and repack and copy which checks the value of the synchronous_commit parameter and performs periodic pauses according to how it’s set. This is a bit like the idea of doing “batch commits” during large bulk data loads, but we don’t need a real commit – we just need to periodically wait for the remote LSN to catch up, according to the value of synchronous_commit. This would provide a bit more healthy back-pressure to throttle those bulk operations, and might protect the rest of the system from such dramatic negative impact.
It might also be good to come up with some monitoring queries which can make it clear when a single connection is flooding the WAL stream with one bulk operation, versus an aggregate total across many write-heavy connections.
.

Sanitized SQL
A couple times within the past month, I’ve had people send me a message asking if I have any suggestions about where to learn postgres. I like to share the collection of links that I’ve accumulated (and please send me more, if you have good ones!) but another thing I always say is that the public postgres slack is a nice place to see people asking questions (Discord, Telegram and IRC also have thriving Postgres user communities). Trying to answer questions and help people out can be a great way to learn!
Last month there was a brief thread on the public postgres slack about the idea of sanitizing SQL and this has been stuck in my head for awhile.

The topic of sensitive data and SQL is actually pretty nuanced.
First, I think it’s important to directly address the question about how to treat databases schemas – table and column names, function names, etc. We can take our cue from the many industry vendors with data catalog, data lineage and data masking products. Schemas should be internal and confidential to a company – but they are not sensitive in the same way that PII or PCI data is. It’s generally okay to share schema information with vendors (for example, while working together on a support ticket for database performance). Within a company, it’s desirable for most schemas to be discoverable by engineers across multiple development teams – this is worth the benefits of better collaboration and better architecture of internal software.
General Principle: Schema = Source Code
Unfortunately, the versatile SQL language does not cleanly separate things. A SQL statement is a string that can mix keywords and schema and data all together. As Benoit points out in the slack thread – there are prepared (parameterized) statements, but you can easily miss a spot and end up with literal strings in queries. And I would add that most enterprises have the occasional need for manual “data fixes” which often involve simple scripts where literal values are common.
Benoit’s suggestion was to run a full parse of the query text. This is a good idea – in fact PgAnalyze already maintains a standalone open-source library which can be used to directly leverage Postgres’ query parser in many languages. This is really the best solution. However it is worth noting that I’m interested in cases of post-processing query texts from pg_stat_activity and pg_stat_statements, both of which have maximum lengths and will truncate text that’s longer. So query parsing would need to still work with truncated texts that throw syntax errors.
The PgAnalyze library approach is interesting, but I think a simple regex-based approach actually has a lot of merit. This can give very useful sanitized SQL for developers to debug, it has very low risk of exposing sensitive data, and the code is incredibly simple… especially compared with importing the entire postgres parser and trying to link to compiled C libraries in other languages!
Tonight I finally got around to a POC for this.
My design choices here were very intentional:
- I’m stripping out comments because libraries like sqlcommenter will add unique values via comments which break any ability to aggregate and summarize and report top queries or problem queries.
- I would always include the query_id alongside the sanitized SQL text. A user can always go back to the database later and look directly at pg_stat_statements to get the full query text as long as they have the Query ID.
- My decision to include the first three words (excluding comments) and two words following every occurrence of FROM is very strategic. In most cases (CTEs being the exception), the first three words will tell what kind of command is being executed – SELECT or DML or DDL or some utility/misc statement. By including two words after the command, we will generally see the table name for inserts and updates. By including words after FROM, we’ll know at least one of the tables being operated on for queries and deletes. This means we always know at a glance “it’s updating table X” or “it’s querying table Y”.
- When wait events indicate lock contention or increasing IO time, it’s extremely useful to see which tables are being operated on.
- There may be a few cases where this algorithm’s sanitized SQL isn’t as useful as it could be. But that’s why we include the Query ID for retrieving the full query text if needed – and my main goal here is just to have something that’s cheap/easy and helpful most of the time and that we can ensure is safe for developers and operators without requiring PII/PCI data controls.
- The likelihood of this algorithm emitting sensitive data is next-to-zero. We shouldn’t get literals from INSERTs or UPDATEs. Function and procedure calls must always include parentheses, so that’s mitigated with a simple regex to nuke anything after an open-parenthesis.
- If the string ‘FROM’ occurs in a string literal, then we aren’t going to distinguish that from a keyword. This is worth consideration; there is an injection vector here if you can spot it. But I don’t think it’s worthwhile to get fancy and attempt to parse SQL via regex. (As fun as that would be, simplicity/readability/maintainability wins here.) The SQL language is insanely sophisticated and if we’re going to parse then it’s the PgAnalyze way. But in practice, the actual surface area and exposure/leak risk with this regex-based function is very small and likely can be mitigated.
- This does not lessen the importance of good coding practices like parameterized SQL. This is just an additional layer of defense on top of that. Values correctly passed through parameterized SQL will never appear in a query text in the first place.
https://gist.github.com/ardentperf/44e94ac484e53ff8353f6c1dc0b8f272
Here’s what the code looks like:
CREATE OR REPLACE FUNCTION sanitize_sql(sql_text text)
RETURNS text AS $$
DECLARE
    cleaned_text text;
    first_part_regex_3words text := '([^[:space:]]+)[[:space:]]+([^[:space:]]+)[[:space:]]+([^[:space:]]+)';
    first_part_regex_2words text := '([^[:space:]]+)[[:space:]]+([^[:space:]]+)';
    first_part_regex_1words text := '([^[:space:]]+)';
    first_part text;
    match_array text;
    from_parts_regex_3words text := '(FROM)[[:space:]]+([^[:space:]]+)[[:space:]]*([^[:space:]]*)';
    from_parts text := '';
BEGIN
    -- Remove multi-line comments (/* ... */)
    cleaned_text := regexp_replace(sql_text, '/\*.*?\*/', '', 'g');

    -- Remove single-line comments (-- to end of line)
    cleaned_text := regexp_replace(cleaned_text, '--.*?(\n|$)', '', 'g');

    -- Extract the first keyword and up to two words after it
    first_part := array_to_string(regexp_match(cleaned_text,first_part_regex_3words),' ');
    if first_part is null or first_part ILIKE '% FROM %' or first_part ILIKE '% FROM' then
      first_part := array_to_string(regexp_match(cleaned_text,first_part_regex_2words),' ');
      if first_part is null or first_part ILIKE '% FROM' then
        first_part := array_to_string(regexp_match(cleaned_text,first_part_regex_1words),' ');
      end if;
    end if;
    first_part := regexp_replace(first_part, '\(.*','(...)');

    -- Find all occurrences of FROM and two words after each
    FOR match_array IN
        SELECT array_to_string(regexp_matches(cleaned_text,from_parts_regex_3words,'gi'),' ')
    LOOP
        match_array := regexp_replace(match_array, '\(.*','(...)');
        from_parts := from_parts || '...' || match_array;
    END LOOP;

    -- Return combined result
    RETURN first_part || from_parts;
END;
$$ LANGUAGE plpgsql;
postgres=# SELECT sanitize_sql($test$

SELECT pgp_sym_encrypt('123-45-6789', 'my_secret_key') AS encrypted_ssn;

$test$);

        sanitize_sql
-----------------------------
 SELECT pgp_sym_encrypt(...)
(1 row)
postgres=# SELECT sanitize_sql($test$

-- Fetch active users only
SELECT id, name  -- user info
FROM users /* main table */
WHERE active = TRUE; /* status flag */

$test$);

            sanitize_sql
------------------------------------
 SELECT id, name...FROM users WHERE
(1 row)
postgres=# SELECT sanitize_sql($test$

SELECT id, name
FROM users
WHERE id IN (
    /* subquery for high-value customers */
    SELECT user_id  -- link to users.id
    FROM orders
    WHERE total > 100  -- filter expensive orders
);
-- end of query

$test$);

                      sanitize_sql
--------------------------------------------------------
 SELECT id, name...FROM users WHERE...FROM orders WHERE
(1 row)
postgres=# SELECT sanitize_sql($test$

-- recent orders per user
WITH recent_orders AS (
    SELECT user_id, MAX(created_at) AS last_order
    FROM orders
    GROUP BY user_id  /* aggregation */
)
SELECT u.name, r.last_order
FROM users u
JOIN recent_orders r ON u.id = r.user_id;  -- join results

$test$);

                       sanitize_sql
----------------------------------------------------------
 WITH recent_orders AS...FROM orders GROUP...FROM users u
(1 row)
postgres=# SELECT sanitize_sql($test$

INSERT INTO users (name, email, created_at)
VALUES (
    'Alice', -- first name
    'alice@example.com', /* email */
    NOW() /* timestamp */
);
-- new user inserted

$test$);

   sanitize_sql
-------------------
 INSERT INTO users
(1 row)
postgres=# SELECT sanitize_sql($test$

UPDATE users
SET last_login = NOW()  -- set current time
WHERE id = 42 /* target specific user */;  -- done

$test$);

   sanitize_sql
------------------
 UPDATE users SET
(1 row)
postgres=# SELECT sanitize_sql($test$

/*
 * Delete old sessions.
 * Keep data from the last 30 days.
 * Be careful: irreversible.
 */
DELETE FROM sessions
WHERE last_access < NOW() - INTERVAL '30 days';

$test$);

         sanitize_sql
------------------------------
 DELETE...FROM sessions WHERE
(1 row)
postgres=# SELECT sanitize_sql($test$

-- Upsert settings
INSERT INTO user_settings (user_id, theme, notifications)
VALUES (
    1, /* user id */
    'dark',  -- theme
    TRUE  -- notifications on
)
ON CONFLICT (user_id)
DO UPDATE
SET theme = EXCLUDED.theme,  -- overwrite
    notifications = EXCLUDED.notifications;

$test$);

       sanitize_sql
---------------------------
 INSERT INTO user_settings
(1 row)
postgres=# SELECT sanitize_sql($test$

-- mark inactive users
WITH inactive_users AS (
    SELECT id
    FROM users
    WHERE last_login < NOW() - INTERVAL '1 year'  /* cutoff */
)
UPDATE users
SET active = FALSE
WHERE id IN (
    SELECT id FROM inactive_users  -- CTE reference
);

$test$);

                            sanitize_sql
--------------------------------------------------------------------
 WITH inactive_users AS...FROM users WHERE...FROM inactive_users );
(1 row)
postgres=# SELECT sanitize_sql($test$

-- create table if missing
CREATE TABLE IF NOT EXISTS audit_log (  /* audit records */
    id SERIAL PRIMARY KEY, -- identity column
    user_id INT REFERENCES users(id),  /* FK */
    action TEXT NOT NULL,  -- what happened
    created_at TIMESTAMP DEFAULT NOW() /* timestamp */
);

$test$);

  sanitize_sql
-----------------
 CREATE TABLE IF
(1 row)
postgres=# SELECT sanitize_sql($test$

/*
   This query finds top customers.
   It uses multiple CTEs and subqueries.
*/
WITH order_totals AS (
    SELECT user_id, SUM(total) AS lifetime_value
    FROM orders
    GROUP BY user_id  -- one row per user
),
top_customers AS (
    SELECT user_id
    FROM order_totals
    WHERE lifetime_value > 10000  /* threshold */
)
SELECT u.id, u.name, o.lifetime_value  -- main output
FROM users u
JOIN order_totals o ON u.id = o.user_id
WHERE u.id IN (SELECT user_id FROM top_customers)
ORDER BY o.lifetime_value DESC  /* high to low */
LIMIT 10;  -- top 10

$test$);

                                                 sanitize_sql
---------------------------------------------------------------------------------------------------------------
 WITH order_totals AS...FROM orders GROUP...FROM order_totals WHERE...FROM users u...FROM top_customers) ORDER
(1 row)
postgres=# SELECT sanitize_sql($test$

SELECT * FROM generate_series(1,10);

$test$);

             sanitize_sql
--------------------------------------
 SELECT *...FROM generate_series(...)
(1 row)
postgres=# SELECT sanitize_sql($test$

DO $$
DECLARE
    tbl RECORD;
BEGIN
    OPEN table_cursor;
    LOOP
        FETCH table_cursor INTO tbl;
        EXIT WHEN NOT FOUND;
        EXECUTE 'VACUUM ' || tbl.tablename;
    END LOOP;
    CLOSE table_cursor;
END $$;

$test$);

 sanitize_sql
---------------
 DO $$ DECLARE
(1 row)
postgres=# SELECT sanitize_sql($test$

-- Declare a cursor for employees in Engineering
DECLARE emp_cursor CURSOR FOR
SELECT id, name, salary
FROM employees
WHERE department = 'Engineering';

$test$);

                   sanitize_sql
--------------------------------------------------
 DECLARE emp_cursor CURSOR...FROM employees WHERE
(1 row)
postgres=# SELECT sanitize_sql($test$

SELECT
    c.name AS customer_name,
    o.order_id,
    o.order_date,
    oi.product_name,
    oi.quantity,
    'Orders coming from customers are listed below' AS description
FROM customers c, orders o, order_items oi
WHERE c.customer_id = o.customer_id
  AND o.order_id = oi.order_id
ORDER BY c.name, o.order_date;

$test$);

                       sanitize_sql
-----------------------------------------------------------
 SELECT c.name AS...from customers are...FROM customers c,
(1 row)
.
Seattle Postgres User Group Video Library
Are you in the Pacific Northwest?
- Thursday Nov 6 at 6pm Bohan Zhang – a member of the technical staff at OpenAI – is returning to speak again at the Seattle Postgres User Group! This time, Bohan will be talking about how OpenAI runs Postgres – challenges faced, lessons learned from outages, and strategies implemented to scale PostgreSQL to handle millions of queries per second (QPS).
- Seattle Systems meetup still needs meetup locations to host us. If you are a company in the Seattle area with space for an in-depth technical talk and 50-100 people, then please reach out to Sitesh (I can help get you in touch).
Since January 2024 we’ve been recording the presentations at Seattle Postgres User Group. After some light editing and an opportunity for the speaker to take a final pass, we post them to YouTube. I’m perpetually behind (I do the editing myself) so you won’t find the videos from this fall yet – but we do have quite a few videos online! Many of these are talks that you can’t find anywhere else. We definitely love out-of-town speakers – but an explicit goal of the user group is also to be an easy place for folks here in Seattle to share what we know with each other, and to be an easy place for people to try out speaking with a small friendly group if they never have before.
https://www.youtube.com/@seattle-postgres
DateSpeakerTitleJune 12 2025Noah BaculiFrom Side Projects: Why We Chose Rust for Postgres + AI (YouTube)May 7 2025Gwen ShapiraRe-engineering Postgres for Millions of Tenants (YouTube)April 10 2025Jonathan KatzVectors: Best practices for a nasty data type (YouTube)March 6 2025Harry PiersonTime Travel Queries with Postgres (YouTube)February 6 2025Rishu BaggaManaging Transaction Metadata in PostgreSQL (YouTube)December 5 2024Kellyn GormanBenchmarking PostgreSQL-Compatible DBs with HammerDB (YouTube)October 10 2024Saraj MunjalDDL Schema Migrations: Navigating the High-Scale Seas (YouTube)September 5 2024Ben ChobotSecure pgBouncer: Break Up With Passwords and Hook Up with AWS Aurora (YouTube)June 6 2024Deon GillSo You Want to Build a Postgres Server (YouTube)May 2 2024Eric LendvaiDatawharf and Wharf Systems (YouTube)April 4 2024Jerry SievertDeveloping Your Own Postgres Database Extensions (YouTube)March 7 2024Bohan ZhangThe Part Of PostgreSQL I Hate The Most: MVCC and How To Optimize It (YouTube)January 18 2024Chelsea DoleIt’s Not You, It’s Me: “Breaking Up” With Massive Tables via Partitioning (YouTube)March 2 2023—Thoughts & Opportunities – Seattle PostgreSQL User Group (intro) (YouTube)By the way – if you’re wondering why our logo is a giant pink elephant, it’s because this is actually a well-known real historical landmark in Seattle!
https://www.meetup.com/seattle-postgres/

A couple people have noticed that we haven’t taken down the old website (which predated the meetup.com site) at https://seapug.org/ … we’ve been talking for several years now about updating this site but we’re all so busy that nothing has happened yet. Regardless, this site is an interesting window into Seattle Postgres User Group meetups all the way back to 2009 (!!)
Testing CloudNativePG Preferred Data Durability
This is the third post about running Jepsen against CloudNativePG. Earlier posts:
- Run Jepsen against CloudNativePG to see sync replication prevent data loss
- Losing Data is Harder Than I Expected
First: shout out to whoever first came up with Oracle Data Guard Protection Modes. Designing it to be explained as a choice between performance, availability and protection was a great idea.
Yesterday’s blog post described how the core of all data safety is copies of the data, and the importance of efficient architectures to meet data safety requirements.
With Postgres, three-node clusters ensure the highest level of availability if one host fails. But two-node clusters are often worth the cost savings in exchange for a few seconds of unavailability during cluster reconfigurations. Similar to Oracle, Postgres two-node clusters can be configured to maximize performance or availability or protection.
Oracle Data Guard modeBehaviorPatroni configurationCloudNativePG configurationMax Performanceoracle defaultAsync; fastest commits; possible data loss on failoverpatroni defaultcnpg defaultMax Availability (NOAFFIRM)Sync when standby available; acknowledge after standby write (not flush); if none available, don’t block
synchronous_mode: truesynchronous_commit: remote_writemethod: anynumber: 1dataDurability: preferredsynchronous_commit: remote_writeMax Availability (AFFIRM)Sync when standby available; acknowledge after standby flush; if none available, don’t blocksynchronous_mode: truemethod: anynumber: 1dataDurability: preferredMax ProtectionAlways sync; if no sync standby, block commits (no data loss)synchronous_mode: truesynchronous_mode_strict: truemethod: anynumber: 1
Automated failovers can involve a small amount of data loss with maximum performance and maximum availability configurations. With Oracle Fast-Start Failover, the FastStartFailoverLagLimit configuration property indicates the maximum amount of data loss that is permissible in order for an automatic failover to occur.
The previous blog post in this series compared CloudNativePG Max Performance and Max Protection modes. Now I want to take a look at Max Availability. In CloudNativePG, the key setting here is spec.postgresql.synchronous.dataDurability. When dataDurability is set to preferred, the required number of synchronous instances adjusts based on the number of available standbys. PostgreSQL will attempt to replicate WAL records to the designated number of synchronous standbys, but write operations will continue even if fewer than the requested number of standbys are available.
All of these experiments were executed on my HP EliteBook (Ryzen Pro 5) with two CNPG Lab VMs via Hyper‑V and the tests ran in a loop for 12–24 hours to aggregate failure rates across the runs.
Experiment 1Using the same test harness as before to indice rapid failures. The test harness waits for all replicas to be READY (per k8s) and then immediately kills the writer.
Hypothesis: in max protection mode we won’t see any data loss, but we will see data loss in max availability mode. Adding a third node to the cluster should reduce the likelihood of data loss.
dataDurabilityinstancesruns showing data lossrequired20% [results]preferred248% [results]preferred34% [results]Findings: Setting dataDurability: preferred in CloudNativePG allows for higher availability but can result in data loss during failover, especially in smaller clusters. I was surprised how much the third node helped.
Hypothesis A: I was seeing a high failure rate specifically because the rapid failures were triggering a failover before CloudNativePG had enough time to restart synchronous replication after the last failure. If there are 60 seconds between each failure, then we shouldn’t see any data loss.
Hypothesis B: CloudNativePG has a failoverDelay setting which can inject a delay before the CNPG reconciliation loop triggers a failover when the primary is unhealthy. If we set this to 60 seconds then we shouldn’t see any data loss.
nb. I also switched to running the latest development build from the trunk of CloudNativePG. (Separately, I had wanted to test some code that was checked in the day before I ran these tests.)
seconds between killsfailoverDelayruns showing data loss0040% [results]6004% [results]0600% [results]Findings: Introducing a delay – either by spacing out failures or by configuring failoverDelay – dramatically reduced or eliminated data loss in preferred mode. When failures occurred back-to-back with no delay, data loss was frequent. However, waiting 60 seconds between failures, or setting a 60-second failoverDelay, allowed CloudNativePG enough time to reestablish synchronous replication, resulting in little or no data loss.
CloudNativePG’s preferred data durability mode offers data safety and high availability with lower-cost two-node clusters by allowing commits to proceed even if the synchronous standby is temporarily unavailable. However, this flexibility comes with a small risk of data loss during failover, especially when failures happen in rapid succession. Introducing delays via the failoverDelay setting minimizes risk. For environments where data durability is paramount, three-node clusters in required mode remain the safest choice, but for those willing to trade a small risk of data loss for improved availability, two-node clusters in preferred mode can be a practical option. Consider setting failoverDelay alongside preferred durability for extra safety.
Data Safety on a Budget
Many experienced DBAs joke that you can boil down the entire job to a single rule of thumb: Don’t lose your data. It’s simple, memorable, and absolutely true – albeit a little oversimplified.
Mark Porter’s Cultural Hint “The Onion of our Requirements” conveys the same idea with a lot more accuracy:
We need to always make sure we prioritize our requirements correctly. In order, we think about Security, Durability, Correctness, Availability, Scalability via Scale-out, Operability, Features, Performance via Scaleup, and Efficiency. What this means is that for each item on the left side, it is more important than the items on the right side.
But this does not tell the whole story. If we’re honest, there is one critical principle of equal importance to everything on this list: Don’t lose all your money.
Every adult who’s managed their own finances knows we don’t have infinite money. Yes we want to keep the data safe. We also want to be smart about spending our money.
Relational databases are one of the most powerful and versatile places to store your data – and they are also one of the most expensive places to store your data. Just look at the per-GB pricing of block storage with provisioned IOPS and low latency, then compare with the pricing of object storage. No contest. Any time a SQL database is beginning to approach the TB range, we definitely should be looking at the largest tables and asking whether significant portions of that data can be moved to cheaper storage – for example parquet files on S3. (Or F3 files?)
Of course, sometimes we need fast powerful SQL and joins and transactions. So relational databases also should run as efficiently as possible. This has direct implications around how we keep the data safe.
From personal photos to enterprise databases, the core of all data safety is copies of the data. Logs and row-store/column-store files (and indexes) are data copies in different formats. You could almost parse the entire database industry through a lense that compares how each technology is just a unique way to replicate data between different formats and places. The revered and time-honored “3-2-1 Backup Rule” is all about copies of the data. From an information theory standpoint, it can be argued that even RAID5 parity, checksums, CRCs, and hashes are a shadow or fingerprint “copy” of the original – even though they aren’t literal full copies of the data.
One of my favorite cultural hints from Mark is: Don’t Let Entropy Win.
In the absence of people making things better, they will get worse. It’s just a fact.
This isn’t Mark’s point, but I think it’s a related concept: at every business that’s successful enough to grow large, there is a natural gravitation toward forming silos of technology. I think of this as a kind of entropy that we need to actively counteract in every large business. Lets look at an example where an enterprise business team building a public API needs a 600GB write-intensive database. Suppose we can buy enterprise grade high-endurance NVMe SSDs (handling write-intensive database workloads) for $1000 each. How much will the storage cost to “keep the data safe” for this public API?
- The business team provisions three environments: one for production and two more for development and testing.
- For business continuity in case of regional problems, the database team creates primary and replica CloudNativePG clusters, so that we are able to run from either of our two regions.
- To maintain high availability, the database team configures CloudNativePG with three instance within each region and they configure preferred anti-affinity so that kubernetes will attempt to schedule the three instances in different buildings or availability zones.
- Persistent storage is provided by the storage team who configures ceph volumes backed by two mirror copies.
- Object storage for backups uses two mirror copies.
- Servers are built by the infrastructure team who configure RAID 1 (mirroring).
In the worst case, we can easily end up spending $96,000 on disks alone – for a database that can fit on a single $1000 enterprise drive! Now that is some crazy storage amplification.

In order to take a smarter approach, lets work backwards from the problems we’re solving. When we say “keep the data safe” – what are some specific situations we want to protect the data from?
- Unavailability during maintenance & deployments at all levels of the stack
- Operational mistakes
- Software bugs at all levels of the stack, from business app to firmware
- Hardware failures of disks
- Hardware failures of servers/compute which can make good disks temporarily inaccessable
- External threats from direct attacks, malware, social engineering, supply chain attacks, etc
- Insider threats arising from situations like personal grievances or personal financial pressures
- Natural disasters (and perhaps political disasters…)
Armed with a list, we can now ask ourselves: what is an economical solution that addresses everything here? There isn’t one right answer but we probably don’t need 12 physical copies of each database per data center. A few ideas:
- Three CNPG instances that use local SSD storage directly (no hardware RAID), for a total of three copies in the primary data center.
- Two or three CNPG instances that use either ceph block storage or local SSD with hardware RAID (but not both) for a total of four or six copies in the primary data center.
- A single CNPG instance in the second data center, with the capability to dynamically add instances on switchovers/failovers.
- Slower, less expensive disks for development databases.
- No CNPG instance for immediate switchover/failover of development databases in second data center.
- Testing tier that matches production config but can be provisioned on demand from backups for load testing, and deprovisioned when unused for some period of time. Development tier also provisioned on demand and deprovisioned when unused for some period of time.
There are many ways to keep data safe on a reasonable budget – these are just a few ideas.
Postgres Replication Links
Our platform team has a regular meeting where we often use ops issues as a springboard to dig into Postgres internals. Great meeting today – we ended up talking about the internal architecture of Postgres replication. Sharing a few high-quality links from our discussion:
Alexander Kukushkin’s conference talk earlier this year, which includes a great explanation of how replication works
- https://posetteconf.com/speakers/alexander-kukushkin/
- https://www.youtube.com/watch?v=PFn9qRGzTMc
- https://www.postgresql.eu/events/pgconfde2025/sessions/session/ 6559-myths-and-truths-about-synchronous-replication-in-postgresql/
- https://www.postgresql.eu/events/pgconfde2025/sessions/session/ 6559/slides/663/Myths%20and%20Truths%20about%20 Synchronous%20Replication%20in%20PostgreSQL.pdf
Alexander’s interview on PostgresTV with Nik Samokhvalov
PostgresFM episode about synchronous_commit
Postgres Documentation for pg_stat_replication system catalog (most important source of replication monitoring data)
CloudNativePG source code that translates pg_stat_replication data into prometheus metrics
- https://github.com/cloudnative-pg/cloudnative-pg/blob/main/config/manager/default-monitoring.yaml#L385
Chapter about streaming replication in Hironobu Suzuki’s book, Internals of PostgreSQL
Here is very helpful diagram from Alexander’s slide deck, which we referenced heavily during our discussion.
Can you identify exactly where in this diagram the three lag metrics come from? (write lag, flush lag and replay lag)
