Re: OEM Cloud Control 13c strange Time Range for Top Activity
Date: Mon, 9 Apr 2018 15:13:28 -0700
Message-ID: <CAJUY3dSTR8VY5_8juH+4GgHPP98Nt62Ng+nTtADnRz1MHSOU5w_at_mail.gmail.com>
What kind of information should I look for? There are sessions "ON CPU" or
'WAITING" at all hours from V$ACTIVE_SESSION_HISTORY and
DBA_HIST_ACTIVE_SESS_HISTORY.
On Mon, Apr 9, 2018 at 4:54 AM, Hemant K Chitale <hemantkchitale_at_gmail.com>
wrote:
> Can you query V$ACTIVE_SESSION_HISTORY or DBA_HIST_ACTIVE_SESS_HISTORY
Thank you.
> in the target DB Instance to see if there is info on active sessions in the
> "missing" window ? Use SAMPLE_TIME
>
>
>
> sent from my mobile phone
>
> On Wed, 4 Apr 2018, 05:20 Chen Zhou, <oracle.unknowns_at_gmail.com> wrote:
>
>> Hi,
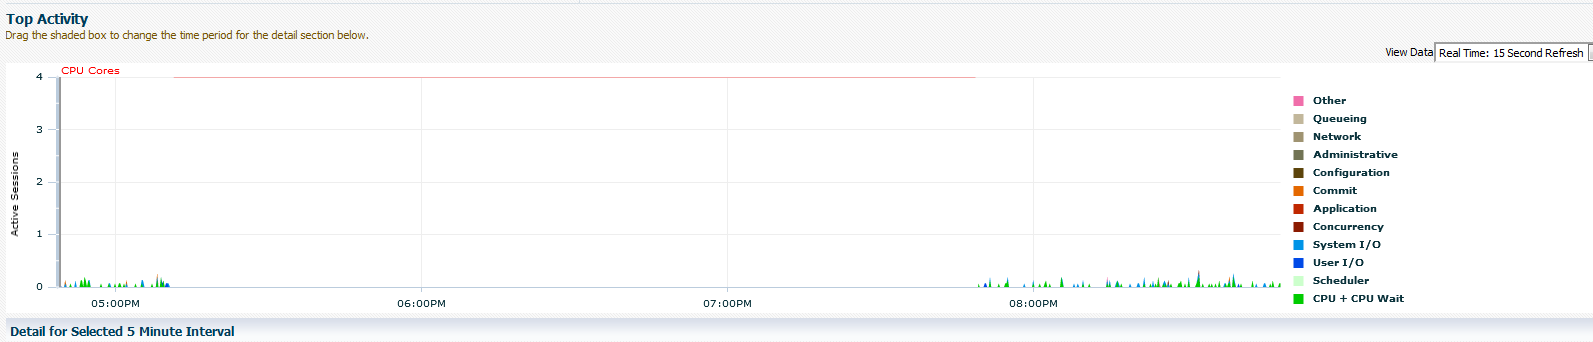
>> I wonder if anyone had this problem before. One of the monitored
>> databases/Performance/Top Activity page opens up perfectly normal with 1
>> hour time range. After 15 seconds, the page is auto-refreshed, then the
>> time range is changed to about 4 hours. There is a 3-hour gap with no
>> performance data.
>>
>> This OEM monitors other databases, but only this particular database has
>> this problem. And it doesn't matter which browser I use. I tried to
>> remove the database target and re-register it and it didn't help.
>>
>>
>> Thank you,
>> Chen
>>
>
-- http://www.freelists.org/webpage/oracle-lReceived on Tue Apr 10 2018 - 00:13:28 CEST
- image/png attachment: image.png