Re: Excessive Logical IOs against which Table/Index
Date: Sat, 30 Apr 2016 12:35:13 +0530
Message-ID: <CAM98S+J2DLe_sS44p_GDMfcBF3U-YsbOWHEe6dSah8SM7iOYEA_at_mail.gmail.com>
Thanks Tim and Karl, for your your suggestions.
On Wed, Apr 27, 2016 at 10:27 PM, Karl Arao <karlarao_at_gmail.com> wrote:
>
>
> In your case you can easily compare the stats from the dba_hist_sqlstat
> and compare the good and bad execution plan then validate it with ASH
> (SQL_PLAN_LINE_ID, SQL_PLAN_OPERATIONS, SQL_PLAN_OPTIONS) then in this case
> you’ll be able to clearly tell which indexes are used or not but this will
> not tell you if it’s dropped or if something has changed on the
> environment.
>
>
>
> If you’d like to know the changes on the before and after then you can use
> SQLT-compare http://karlarao.tiddlyspot.com/#SQLT-compare. You can just
> pull the good and bad plan hash values and then execute the compare then it
> will highlight in red the missing indexes in your case.
>
>
>
> If let’s say your scenario is just spinning on CPU and the ASH is just
> telling you the SQL_ID is just 100% on CPU. Then just use snapper and
> pstack. And you can compare/profile the good and bad sessions. The commands
> and an example scenario is shown here -> LIO instrumentation, gather=a
> (latch, enqueue, buffer gets where) http://bit.ly/1Uhparn
>
>
>
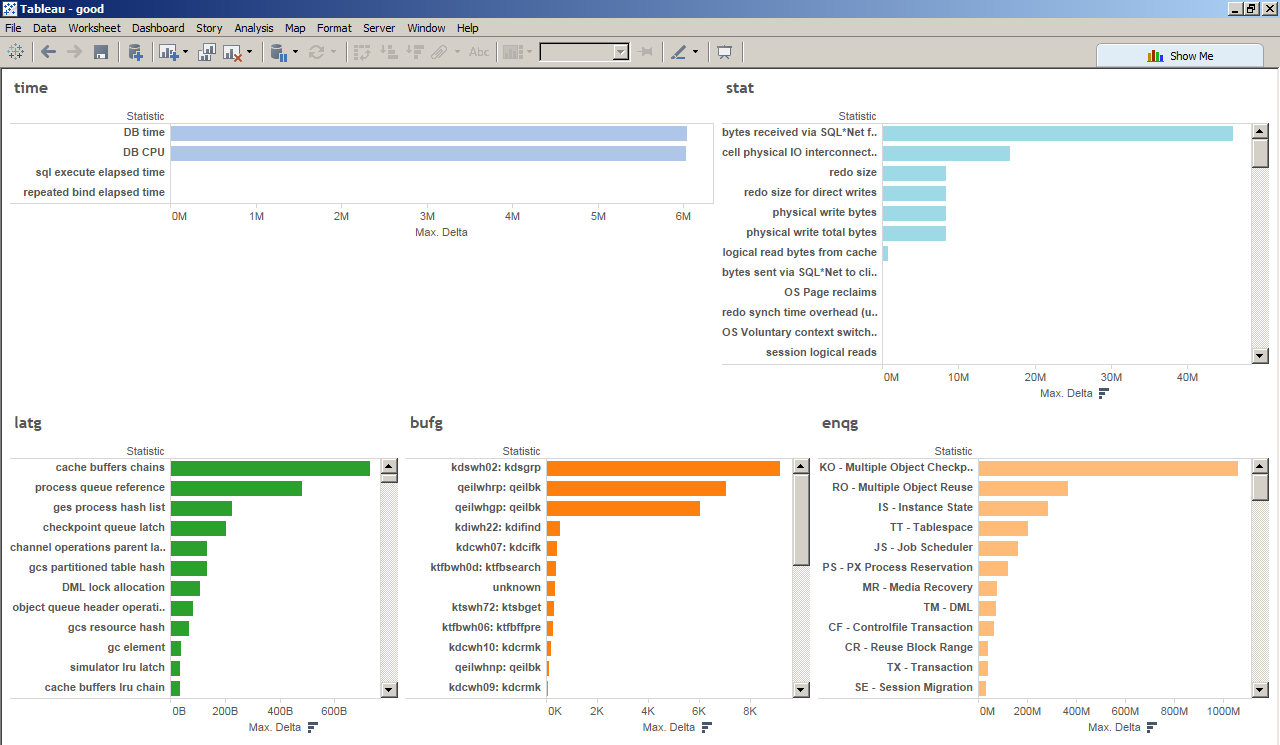
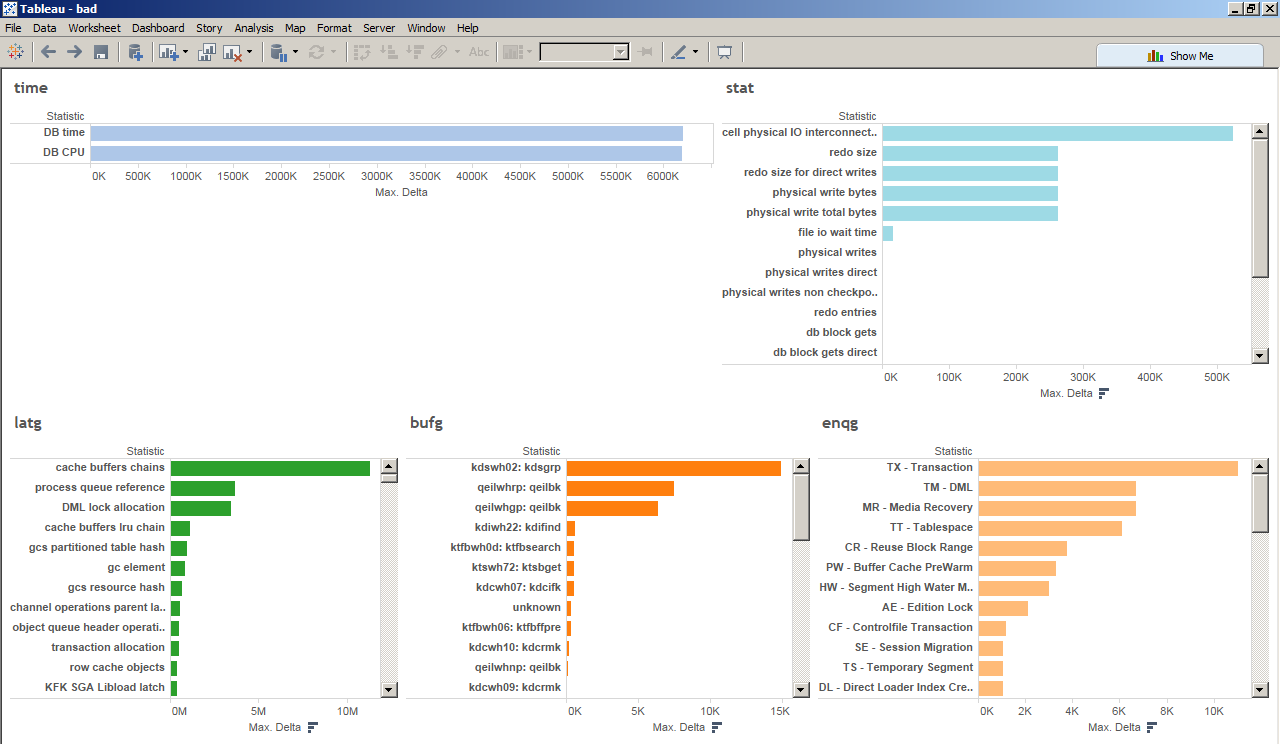
> Sample viz on the URL are here
>
>
> https://raw.githubusercontent.com/karlarao/blog/82d44c4578e610044eef25f62b6c25d4ffb181b7/images/20160427_lios/good.png
>
>
> https://raw.githubusercontent.com/karlarao/blog/82d44c4578e610044eef25f62b6c25d4ffb181b7/images/20160427_lios/bad.png
>
>
>
>
>
>
> -Karl
>
>
>
>
>
>
>
>
>
>
>
>
>
> On Mon, Apr 25, 2016 at 1:10 PM, Jessica Mason <jessica.masson85_at_gmail.com
> > wrote:
>
>>
>> Hello List,
>>
>> Last week, I was involved in a production issue, where a data load job,
>> which normally takes few hours to complete, had been running for more than
>> 48 hours. I tried to take the following systematic approach to identify the
>> cause -
>>
>> Step 1 - Identify the session and started profiling it. All the time, the
>> session was on CPU.
>>
>> Step 2 - To understand why the session was burning CPU, the v$sesstat
>> view was queried and below were the top statistics that were changing :
>>
>> 43126075162624 logical read bytes from cache
>> 240440566773 table scan rows gotten
>> 2632208820 session logical reads
>> 2632206511 consistent gets
>> 2632206511 consistent gets from cache
>> 2632205708 consistent gets from cache (fastpath)
>>
>> Step 3 - Next, I wanted to know the object ( table/index) against which
>> these logical IOs were happening so that I could focus on the operations,
>> involving these objects, in the execution plan but didn't know which view
>> to query.
>>
>> The above information could have saved us lot to time to identify the
>> cause ( in this case, an unique index was dropped and Oracle was doing FTS
>> on a table which was referred 6 times in the query fetching million of
>> records).
>>
>> So, my questions to the list is that which v$ view should I have checked?
>> Or is there a better approach to troubleshoot such issues?
>>
>>
>> Thanks
>> JM
>>
>
>
>
> --
> Karl Arao
> Blog: karlarao.wordpress.com
> Wiki: karlarao.tiddlyspot.com
> Twitter: _at_karlarao <http://twitter.com/karlarao>
>
--
http://www.freelists.org/webpage/oracle-l
Received on Sat Apr 30 2016 - 09:05:13 CEST