Re: Performance metrics
Date: Thu, 12 Apr 2012 11:53:43 -0500
Message-ID: <CACNsJnf3ACXOgpzHDTnuQ1ZG=eepd0Vkf=fw+7i-cexCCrzn0g_at_mail.gmail.com>
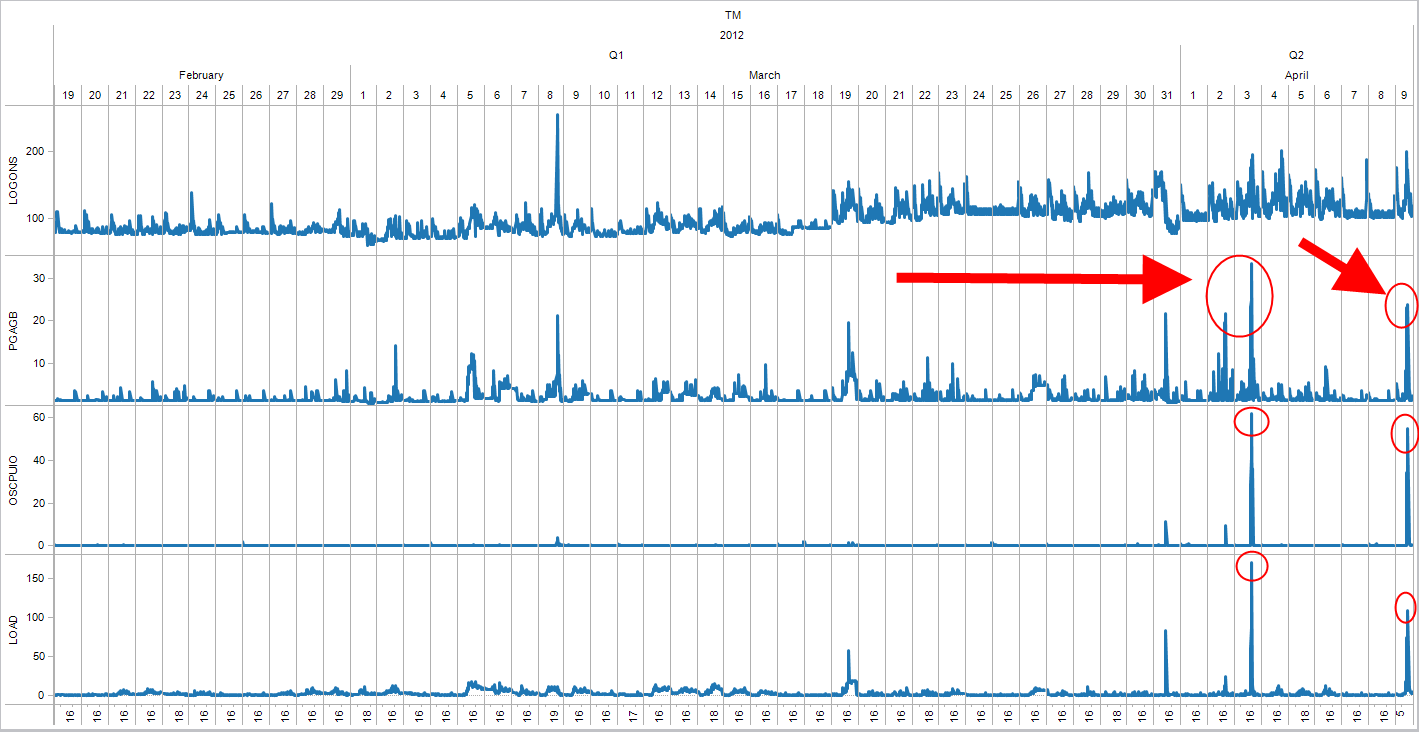
"When things go wrong they point the finger at the database or OS or hardware" <-- yes, and when this happens it's just a matter of getting the facts, numbers, figures and we can point the finger back to them. Take a look at the screenshots below, they are all different scenarios where things gone bad
PGA reaching 30GB when developers fire up new reports that's doing tremendous hash joins eating up the server memory causing the kswapd to kick in and swapping at a high rate which translates to CPU wait IO and high load average.. basically killing the server https://lh4.googleusercontent.com/-AB22fuuzLwE/T4b53Ris6QI/AAAAAAAABio/mu_dIx3A3uE/s2048/20120412-template-PGA.png
New batch of reports were introduced, and we found out that the developers are testing stuff in the PROD environment https://lh4.googleusercontent.com/-rPe_EbL4Md0/T4b53Zf81hI/AAAAAAAABik/g_rZFYUgj68/s2048/20120412-template-aas1-correct-detail.png
Load average spike
https://lh3.googleusercontent.com/-Pnw29AKWRSk/T4b53UOjXwI/AAAAAAAABig/LaPnAsru3rg/s2048/20120412-template-cpu-detail.png
Sudden 15GB/s read caused by just two SQLs https://lh4.googleusercontent.com/-7rTUJIR-Rh0/T4b53qAvoqI/AAAAAAAABi8/lSMhGsF7OEc/s2048/20120412-template-iopsrw-15GBs-detail.png
And since the data points are based in AWR you can drill down on snap_ids, generate ASH at that time period, pick the SQLs.. and regroup with the developers ;)
--
Karl Arao
karlarao.wordpress.com
karlarao.tiddlyspot.com


--
http://www.freelists.org/webpage/oracle-l
Received on Thu Apr 12 2012 - 11:53:43 CDT