Home » Developer & Programmer » Forms » Forms 10g. How to create pie chart in Excel sheet (Forms Builder 10.1.2.0.2, Windows 7)
Forms 10g. How to create pie chart in Excel sheet [message #546872] Fri, 09 March 2012 07:33 Go to next message
calacausi
Messages: 23
Registered: March 2012
Junior Member
hi,
in my Forms application, I must create an Excel sheet with data displayed by a pie chart, i.e. something like this
(http :// imageshack.us/photo/my-images/705/piecharts.jpg/)


I'm able to create the Excel sheet by using OLE2 tool, but I dont know how to create and insert the pie chart.
Searching in this forum, I found this post:
http ://www.orafaq.com/forum/?t=msg&goto=309634&0/&srch=excel+sheet+chart#msg_309634

it's useful, but somewhat hard to understand. In detail, how can I set the form_charttype and form_chartsource so that it would produce my pie chart? Please help. Thank you
  • Attachment: piechart.jpg
    (Size: 251.88KB, Downloaded 924 times)
Re: Forms 10g. How to create pie chart in Excel sheet [message #546892 is a reply to message #546872] Fri, 09 March 2012 15:07 Go to previous messageGo to next message
owais_baba
Messages: 289
Registered: March 2008
Location: MUSCAT
Senior Member
might be it could help u

http://www.oracle.com/technetwork/articles/marx-jchart-085298.html
Re: Forms 10g. How to create pie chart in Excel sheet [message #546893 is a reply to message #546892] Fri, 09 March 2012 15:12 Go to previous messageGo to next message
owais_baba
Messages: 289
Registered: March 2008
Location: MUSCAT
Senior Member
one more link

http://www.rittmanmead.com/2010/09/obiee-11gr1-new-features-in-bi-publisher-11gr1/
Re: Forms 10g. How to create pie chart in Excel sheet [message #547070 is a reply to message #546892] Mon, 12 March 2012 03:00 Go to previous messageGo to next message
calacausi
Messages: 23
Registered: March 2012
Junior Member
owais_baba wrote on Fri, 09 March 2012 22:07
might be it could help u

http :// www.oracle.com/technetwork/articles/marx-jchart-085298.html


hi,
maybe JFreeChart its good for me. I think (hope) I can customize it, create a package and import it into Forms builder. Well, Im going to try. thank you very much
Re: Forms 10g. How to create pie chart in Excel sheet [message #548507 is a reply to message #546872] Thu, 22 March 2012 08:58 Go to previous messageGo to next message
calacausi
Messages: 23
Registered: March 2012
Junior Member
hi,
I think it is possible to build the pie chart using OLE2, instead of installing some external tool. So, I am struggling with Excel sheet features; but instead of a pie chart, I got a histogram, and the data source is wrong.
Here is the code I wrote to build the chart

	workcharts:=OLE2.GET_OBJ_PROPERTY(workbook,'CHARTS'); 
	WORKCHART := ole2.Invoke_obj(workcharts, 'Add'); 
	OLE2.SET_PROPERTY(workchart, 'NAME', 'CHART'); 


	--set chart data source. P_NAME is the name of data sheet (i.e. SUMMARY COSTS 2011-2012-2026)
	--J is the row index where data are stored (i.e. A12:D13)
	args := OLE2.CREATE_ARGLIST;
	OLE2.ADD_ARG(args, 'Sheets("' || P_NAME || '").Range("A' || (J-1) || ':D' || J || '")');
	OLE2.ADD_ARG(args, 'xl3DPieExploded');
--	OLE2.ADD_ARG(args, 'xlColumns');
	OLE2.INVOKE(workchart, 'SetSourceData', args); 
	OLE2.DESTROY_ARGLIST(args);

	OLE2.RELEASE_OBJ(workchart);
	OLE2.RELEASE_OBJ(workcharts);
	...


for you to understand the example, I attached pics of data sheet, expected pie chart and the resulting (wrong) chart.
/forum/fa/9981/0/
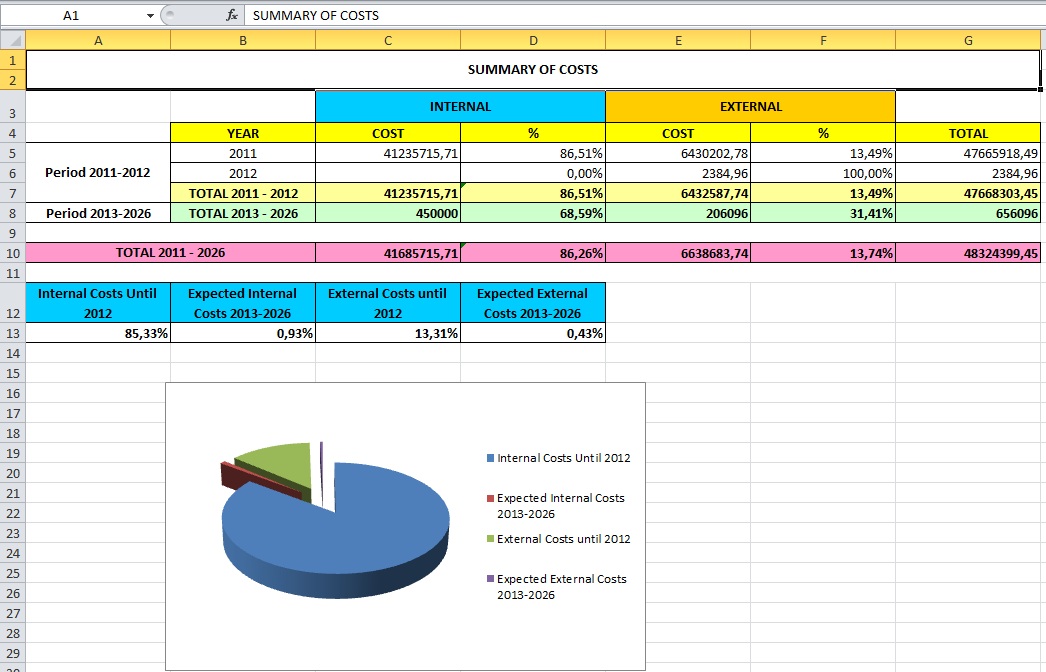
As you can see, the histogram covers all data, and not the range I put in args list.
Furthermore, I would prefer to put the chart within the data sheet and not in a separate sheet. Can someone give me a help?
  • Attachment: test.jpg
    (Size: 175.36KB, Downloaded 2804 times)
Re: Forms 10g. How to create pie chart in Excel sheet [message #548508 is a reply to message #548507] Thu, 22 March 2012 09:00 Go to previous messageGo to next message
calacausi
Messages: 23
Registered: March 2012
Junior Member
here is the wrong chart built by the procedure
/forum/fa/9982/0/

it takes data from the whole data sheet, not from the expected range (A12:D13)
  • Attachment: testChart.jpg
    (Size: 91.75KB, Downloaded 2465 times)
Re: Forms 10g. How to create pie chart in Excel sheet [message #548598 is a reply to message #548508] Fri, 23 March 2012 06:30 Go to previous message
calacausi
Messages: 23
Registered: March 2012
Junior Member
I created a chart by hand and saved steps into a macro. This is the resulting code
Sub chart()
'
' chart Macro
'

'
    Range("A12:D13").Select
    ActiveSheet.Shapes.AddChart.Select
    ActiveChart.ChartType = xl3DPieExploded
    ActiveChart.SetSourceData Source:=Range( _
        "'SUMMARY COSTS 2011-2012-2026'!$A$12:$D$13")
End Sub


maybe the missing step in my oracle procedure is the first (Range("A12:D13").Select). How can I get this? I tried to do it using an arglist
	args:=OLE2.create_arglist;
	STR_FORMULA := 'A' || (J-1); --A12
	OLE2.add_arg(args, STR_FORMULA);
	STR_FORMULA := 'D' || J;     --D13
	OLE2.add_arg(args, STR_FORMULA);
	myRange:=OLE2.get_obj_property(worksheet, 'Range', args);
	OLE2.SET_PROPERTY(myRange,'selected',true);	
	OLE2.destroy_arglist(args);

then I set workchart datasource to myRange; but it doesnt work. I hope you can help me. thanks
Previous Topic: Radio button missmatch values
Next Topic: Dynamical Alert box
Goto Forum:


Current Time: Thu Apr 25 20:31:22 CDT 2024